Figures & data
Table 1. Baseline characteristics of the study subjects.
Table 2. Referral data, presented as n (%).
Table 3. Results from the questionnaire regarding the patient’s own experience of the arrhythmia, symptom duration and referral history.
Table 4. Socioeconomic data from the additional questionnaire.
Figure 1. Comparion of Health-Related Quality of Life (SF-36) at baseline compared to six months, all patients. PF: Physical functioning; RP: Role-Physical; BP: Bodily Pain; GH: General Health; VT: Vitality; SF: Social Functioning; RE: Role-Emotional; MH: Mental Health.
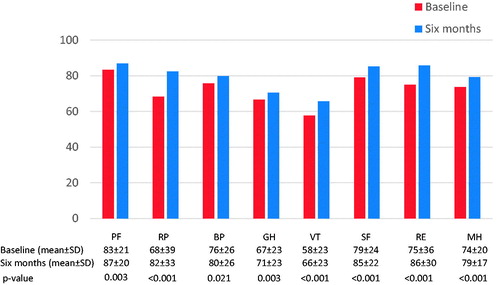
Figure 2. Comparison of Symptoms Checklist. Frequency scale between the sexes at baseline.
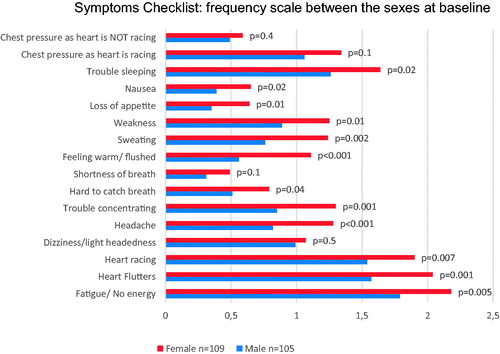
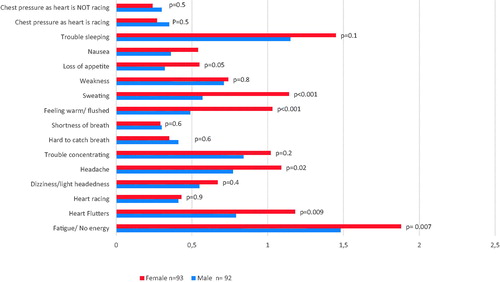
Figure 3. Comparison of Symptoms Checklist. Frequency scale between the sexes at six months.