
Figures & data
Table 1. Patient characteristics (n = 69).
Figure 1. Association of corrected LV lead electrical delay (cQLV) with arrhythmic events among CRT recipients. Figure 1A: cQLV in patients with atria tachycardia/supraventricular tachycardia (AT/SVT) events compared to patients without AT/SVT events (43.4 ± 22% vs. 60.3 ± 26.7%, p = .006.); Figure 1B: cQLV in patients with ventricular tachycardia/fibrillation (VT/VF) events compared to patients without VT/VF events (46.2 ± 25.4% vs. 56 ± 25.7%, p = .13).
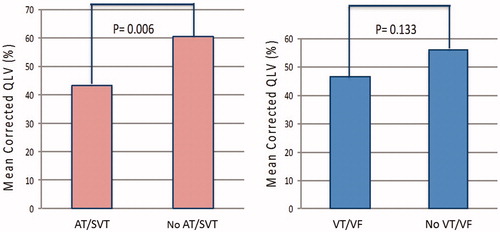
Figure 2. Association of corrected LV lead electrical delay (cQLV) with new onset arrhythmic events among CRT recipients. Figure 2A: cQLV in patients with new onset atria tachycardia/supraventricular tachycardia (AT/SVT) events compared to patients without new onset AT/SVT events (38.3 ± 22.2% vs. 55.7 ± 25.7%, p = .028); Figure 2B: cQLV in patients with new onset ventricular tachycardia/fibrillation (VT/VF) events compared to patients without new onset VT/VF events (44.2 ± 25.2% vs. 56.3 ± 25.5%, p = .069).
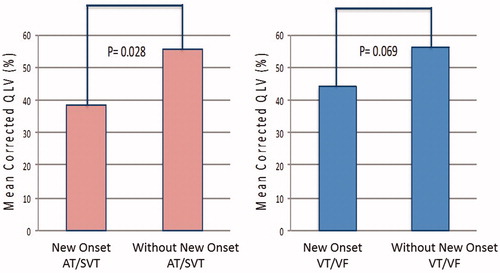
Table 2. Comparison of demographic and clinical characteristics of patients with and without arrhythmic events.
Table 3. Odds ratios for arrhythmic events.