
Figures & data
Table 1. Baseline characteristics.
Figure 1. Prognostic impact of ES-R on all-cause mortality (left panel), overall rehospitalization (middle panel) and MACE (right panel) at long-term follow-up.
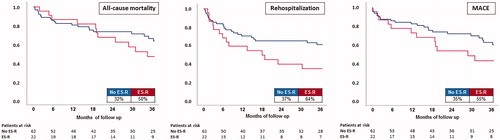
Table 2. Primary and secondary endpoints.
Table 3. Multivariable Cox regression model to evaluate prognostic factors influencing ES-R with LVEF as discrete variable.
Table 4. Multivariable Cox regression model to evaluate prognostic factors influencing ES-R with LVEF as continuous variable.