
Figures & data
Figure 1. Cardiac magnetic resonance evaluation of left atrial fibrosis with the ADAS software.
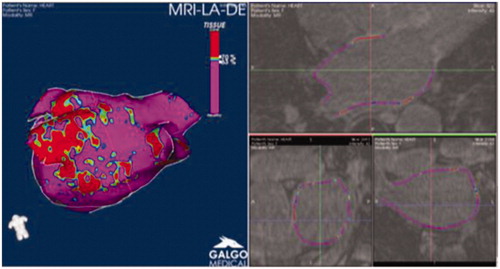
Figure 2. Schematic of aortic pressure wave decomposition into excess pressure and reservoir pressure components.
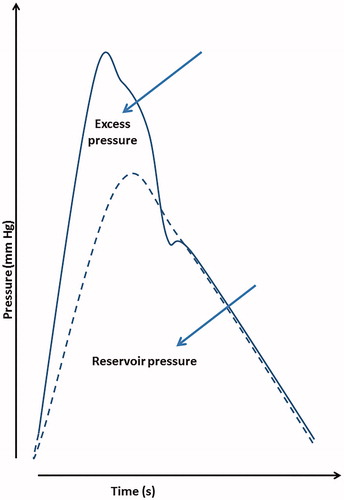
Table 1. Clinical characteristics of the study subjects.
Figure 3. Correlation between left atrial fibrosis area and aortic excess pressure.
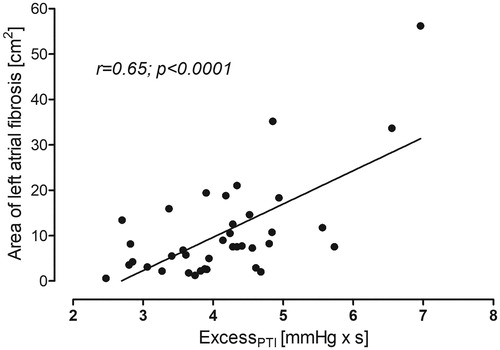
Table 2. Correlation between atrial fibrosis, periventricular white matter lesions, and hemodynamic metrics.
Table 3. Standardized coefficients for multiple linear regression of atrial fibrosis and periventricular white matter lesions volume on independent variables.