
Figures & data
Figure 1. Selection of patients with STEMI who had successfully primary PCI and survived more than 30 days after PCI from 1st January 2003 to 31st December 2009. STEMI: ST-segment elevated myocardial infarction; PCI: Percutaneous coronary intervention.
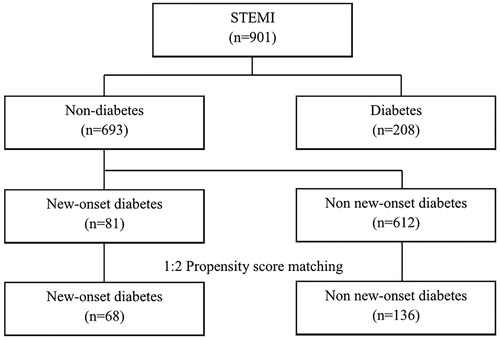
Figure 2. Kaplan-Meier survival curves for free of adverse outcomes in NOD group and non-NOD groups. MACEs: Major adverse cardiac events; MI: Myocardial infarction; NODM: New-onset diabetes.
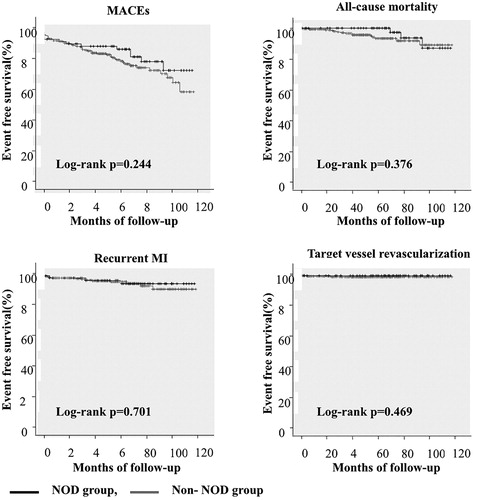
Table 1. Baseline clinical characteristics after 1:2 propensity score matching of non-diabetes patients at index admission.
Table 2. Clinical outcomes of NOD group and non-NOD group after 1:2 propensity score matching.
Table 3. Clinical outcomes of early NOD group and late NOD group.
Table 4. Cox’s proportional hazard model (95% CI).