
Figures & data
Figure 1. Flowchart of patient selection in the first stage of the study. FINAMI: Finnish Myocardial Infarction Register; MI: myocardial infarction; ECG: electrocardiogram; NCMI: not classifiable myocardial infarction; STEMI: ST-elevation myocardial infarction; NSTEMI: non-ST-elevation myocardial infarction; HDR: hospital discharge register.
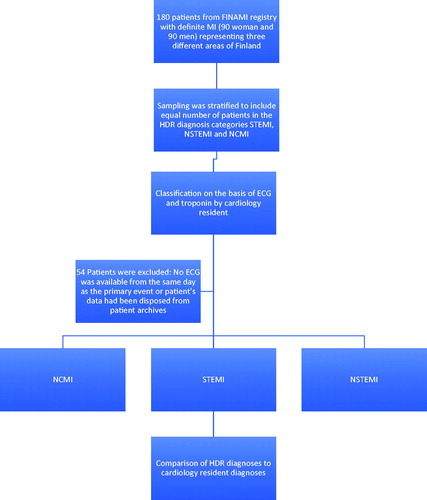
Figure 2. Flowchart of patient selection in the second stage of the study. HDR: hospital discharge register; ECG: electrocardiogram; MI: myocardial infarction; NCMI: not classifiable myocardial infarction; STEMI: ST-elevation myocardial infarction; NSTEMI: non-ST-elevation myocardial infarction.
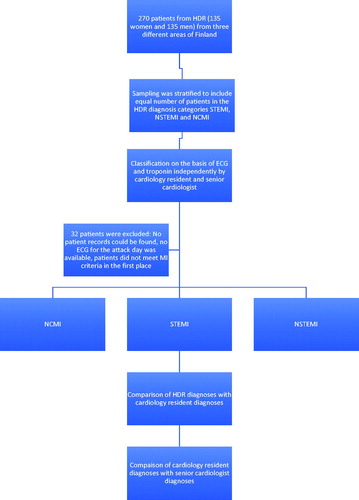
Table 1. Characteristics of FINAMI patients randomly sampled to the study from the HDR.
Table 2. Characteristics of patients randomly sampled to the study from the HDR.
Table 3. Cohen’s kappa and confidence intervals from years 2012 to 2014 by study area for men, women, and total.
Table 4. Sensitivity and specificity and confidence intervals of STEMI diagnoses in HDR compared to classification of the cardiology resident.
Table 5. Sensitivity and specificity and confidence intervals of NSTEMI diagnoses in HDR compared to classification of the cardiology resident.