
Figures & data
Figure 1. Flow diagram of patient recruitment to this study.
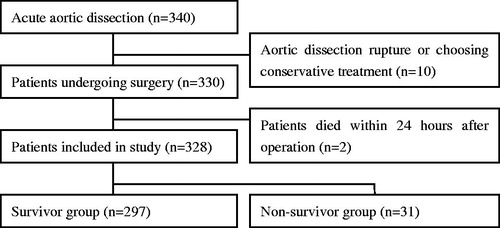
Table 1. Demographic and characteristics of patients with ATAAD.
Table 2. Factors affecting inflammatory markers at T1.
Figure 2. Comparing levels of lgPCT, lgTNF-α, lgIL-2R, lgIL-6, lgIL-8, WBC, and CRP between survivor group and non-survivor group (*p < .05).
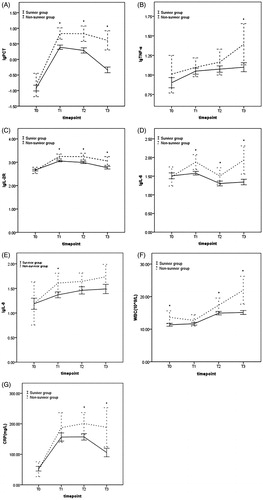
Figure 3. Comparing lg PCT, lg TNF-α, lg IL-2R, lg IL-6, lg IL-8, WBC, and CRP between non-AKI group, AKI stage I/II group, and AKI stage III group (*p < .05).
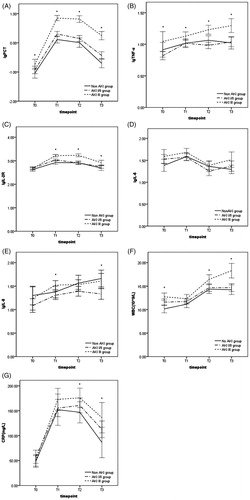
Table 3. Correlations among SOFA and APACHE II scores and serum concentrations of studied biomarkers in the overall group of patients.
Figure 4. ROC curve of the relationship between concentrations of biomarkers at T1 and mortality (A) or AKI stage III (B).
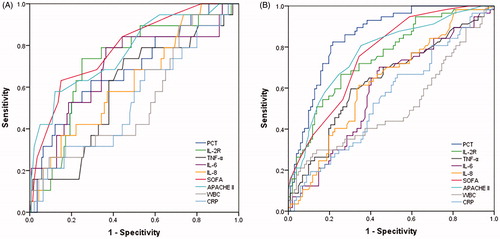
Table 4. Cutoff values of inflammatory markers, cytokines and scores to predict mortality.
Table 5. Cutoff values of inflammatory markers, cytokines, and scores to predict stage III AKI.
Figure 5. ROC curve of combined score to predict mortality.
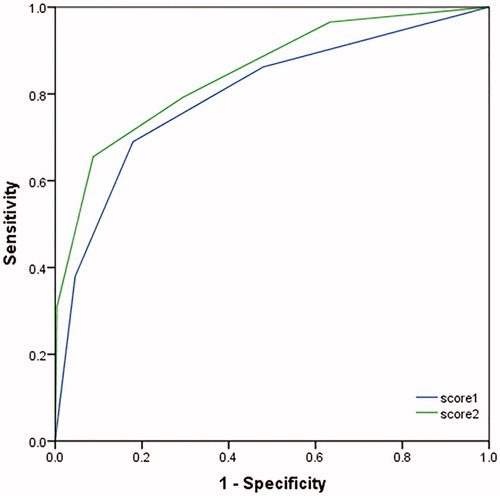
Table 6. Multivariate analysis of in-hospital mortality within 30 days.