
Figures & data
Figure 1. Yearly incidence of infective endocarditis: Number of patients admitted to Division of Cardiovascular and Pulmonary Diseases at Rikshospitalet, Oslo University Hospital, between 2014 and 2017.
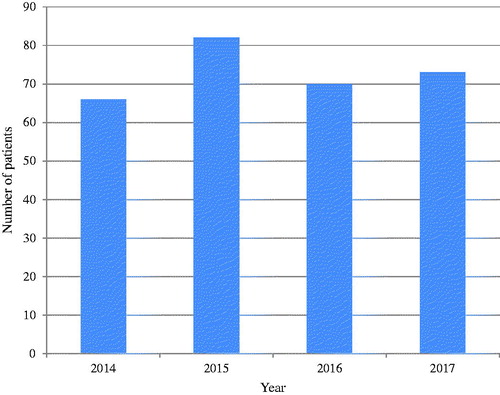
Figure 2. Number of patients admitted with infective endocarditis, sorted by age and sex.
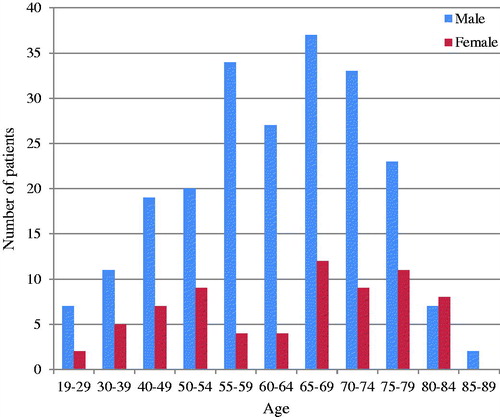
Figure 3. Percentage of infected valves that were native, unoperated or previously operated. Previously operated valves were further divided into biological valve replacements, mechanical valve replacements and valvuloplasties.
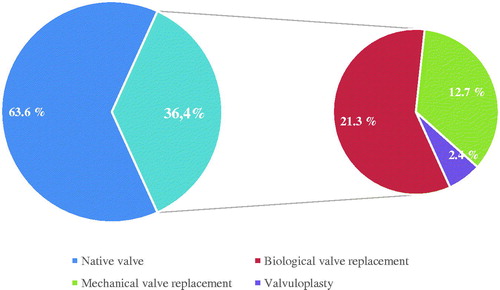
Table 1. Characteristics of the 291 patients with infective endocarditis.
Table 2. Distribution of microbial agents.
Table 3. Characteristics of patients with infective endocarditis treated surgically (n = 238) and conservatively (n = 53).
Figure 4. Kaplan–Meier’s plot illustrating survival rates year by year.
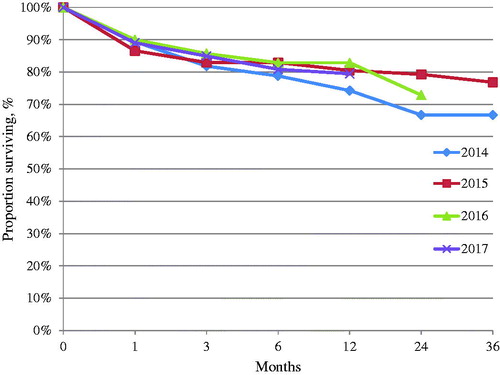
Table 4. Characteristics of patients with infective endocarditis who were alive (n = 231) and dead (n = 60) after 1 year.