Figures & data
Figure 1. Illustration of left ventricular outflow tract in three-dimensional echocardiography and with computer tomography. (a) Example of measurement of LVOT in 3D TTE from the parasternal long-axis view. The 3D images were analysed through three different orthogonal cut planes: The white is a short axis plane of the LVOT and the green and yellow are sagittal views of the ascending aorta. The yellow and green lines were moved to the hinges of the aortic valve to measure the LVOT. (b) Example of CT images and software used to obtain the optimal view of the aortic annulus using three lines representing three orthogonal cut planes.

Table 1. Clinical and echocardiographic characteristics of the study population.
Table 2. Mean ± SD values of LVOT measurements in the 30 patients who were examined with 2D, 3D and CT (left) and in the 13 who had intraoperatiove Hegar sizer measurements.
Table 3. Correlations of LVOT measurements.
Figure 2. Correlation and Bland-Altman plots of LVOT area measurements. Correlations and Bland-Altman plots of 2D TTE LVOT area compared to CT (A) and Haegar sizers (C). The same plots for 3D TTE LVOT area compared to CT (B) and Haegar sizers (D). The dashed line of the scatter plots represents the line of equality. The dashed lines of the Bland-Altman plots represent bias and the dotted lines ± 1.96 standard deviations, Limits of Agreement (LoA).
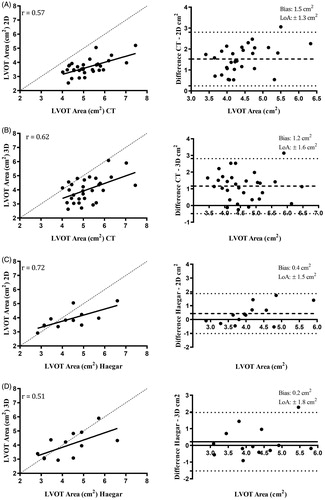
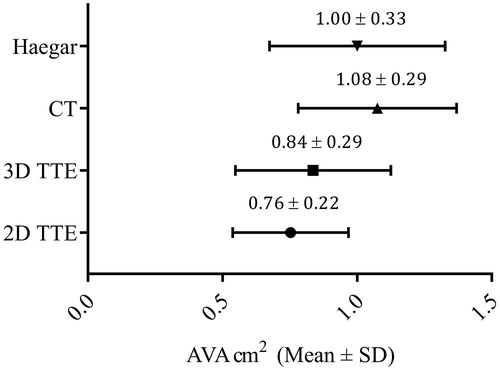
Figure 3. Aortic valve area calculated from LVOT area of the different imaging modalities and Doppler recordings. Mean AVA ± SD calculated by the continuity equation using LVOT area from Haegar sizers, CT and 2D TTE, 3D TTE and Doppler recordings.