1,169
Views
2
CrossRef citations to date
0
Altmetric
Original Articles

Cardiovascular risk unawareness is common in individuals admitting to cardiology outpatient clinics in Turkey: the CVSCORE-TR study

ORCID Icon, , , , , , , & show all
Pages 82-90 | Received 26 Oct 2019, Accepted 04 Sep 2020, Published online: 30 Sep 2020

Figures & data

Table 1. Demographic characteristics, past medical history, laboratory findings and medications for participants with low, intermediate and high/very high risk for mortality from a cardiovascular cause within the next ten years.

Figure 1. Risk awareness according to calculated and perceived cardiovascular risk. Clustered bar graphs showing risk awareness and unawareness in the study population. (A) shows the prevalence of risk awareness and unawareness for individual risk categories, while (B) shows cumulative distribution of calculated risk according to the correct estimation of the risk.

Figure 1. Risk awareness according to calculated and perceived cardiovascular risk. Clustered bar graphs showing risk awareness and unawareness in the study population. (A) shows the prevalence of risk awareness and unawareness for individual risk categories, while (B) shows cumulative distribution of calculated risk according to the correct estimation of the risk.

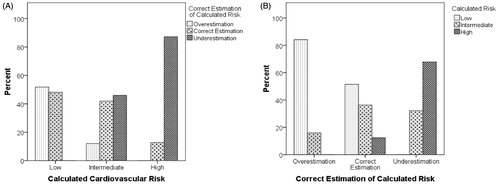
Table 2. Cross tabulations of participants according to calculated and perceived risk (upper table) and calculated risks in participants who were risk aware and risk unaware (lower table).

Figure 2. Distribution of clinical and laboratory parameters according to correct estimation versus underestimation in high-risk group. Box plots showing blood pressure measurements and blood chemistry results for high-risk patients who correctly estimated (n = 73) or underestimated (n = 497) their calculated risk. Boxes show interquartile range, while the horizontal line within the boxes show median value and whiskers indicate uppermost and lowermost values. LDL: low-density lipoprotein; HDL: high-density lipoprotein.

Figure 2. Distribution of clinical and laboratory parameters according to correct estimation versus underestimation in high-risk group. Box plots showing blood pressure measurements and blood chemistry results for high-risk patients who correctly estimated (n = 73) or underestimated (n = 497) their calculated risk. Boxes show interquartile range, while the horizontal line within the boxes show median value and whiskers indicate uppermost and lowermost values. LDL: low-density lipoprotein; HDL: high-density lipoprotein.

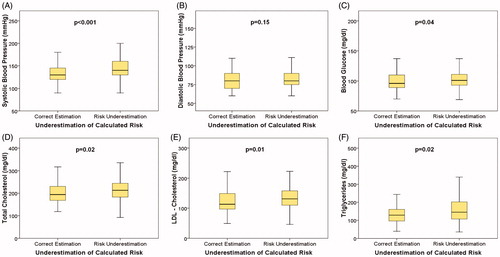
Table 3. Demographic characteristics, past medical history, laboratory findings and medications for participants who overestimated, correctly estimated and underestimated their calculated 10-year mortality risk.

Table 4. Independent predictors of risk underestimation (left side) and overestimation (right side) in multivariate analyses that included relevant demographic and clinical characteristics of participants.

Supplemental material

Supplemental Material

Download MS Word (35.5 KB)

Supplemental Material

Download Zip (39.4 KB)

Reprints and Corporate Permissions

Please note: Selecting permissions does not provide access to the full text of the article, please see our help page How do I view content?

To request a reprint or corporate permissions for this article, please click on the relevant link below:

Academic Permissions

Please note: Selecting permissions does not provide access to the full text of the article, please see our help page How do I view content?

Obtain permissions instantly via Rightslink by clicking on the button below:

If you are unable to obtain permissions via Rightslink, please complete and submit this Permissions form. For more information, please visit our Permissions help page.