Figures & data
Figure 1. Effects of isoproterenol (ISO; 3 μM) on spontaneous ventricular rate changes (A) and contraction force (B) (*p < .05; compared to CD group). Effects of noradrenaline (NA; 30 μM) on spontaneous ventricular rate changes (C) and contraction force (D) (*p < .05; compared to CD group).
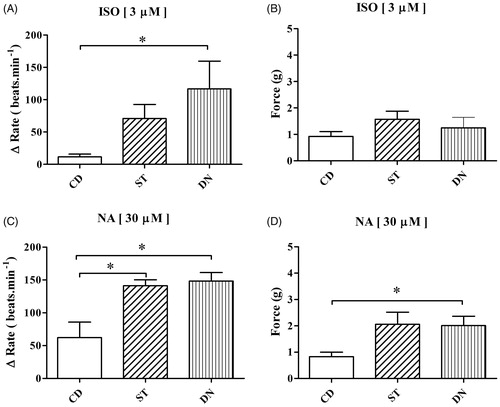
Figure 2. Right ventricular tissues sialic acid (SA) levels (A) in Custodiol (CD), St. Thomas (ST) and del Nido (DN) groups (p > .05; compared with all group). Right ventricular tissues MMP-9 activity (B) and TNF-α levels (C) in Custodiol (CD), St. Thomas (ST) and del Nido (DN) groups (**p < .01 and *p < .05; compared to CD group). Right ventricular tissues adenosine triphosphate (ATP) levels (D) in Custodiol (CD), St. Thomas (ST) and del Nido (DN) groups (***p < .001; compared to CD group).
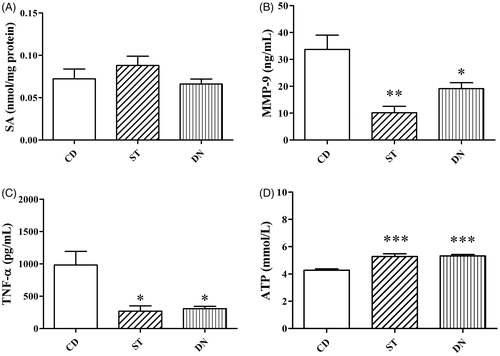
Figure 3. TNF-α (A) and Troponin-I (B) levels in incubation (T1) solution after 4 h (***p < .001 and *p < .05; compared to CD group).
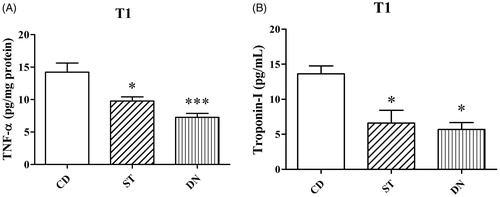
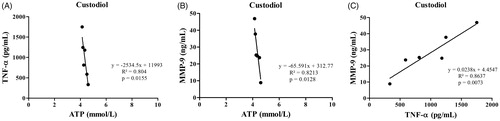
Figure 4. The correlation between ATP-TNF-α levels (A) and ATP level-MMP-9 activity (B) in the right ventricle tissues in Custodiol cardioplegia. The correlation between TNF-α level and MMP-9 activity in the right ventricle tissues in Custodiol cardioplegia (C).