
Figures & data
Table 1. Preoperative clinical characteristics according to the categories of cardiac surgery. The values are means (standard deviations) or n (%).
Figure 1. Thirty-day survival curves for selected patient subgroups. Kaplan–Meier presentations with p values from the log-rank tests. Panel A: New York Heart Association (NYHA) class 3 or 4. Panel B: Pulmonary congestion. Panel C: Renal function. eGFR indicates estimated glomerular filtration rate. Panel D: Preoperative atrial fibrillation.
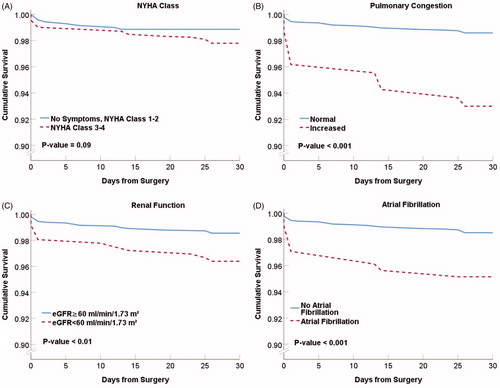
Figure 2. Thirty-day survival in male and female patients with normal or reduced haemoglobin levels. Kaplan–Meier presentation with p value from the log-rank test.
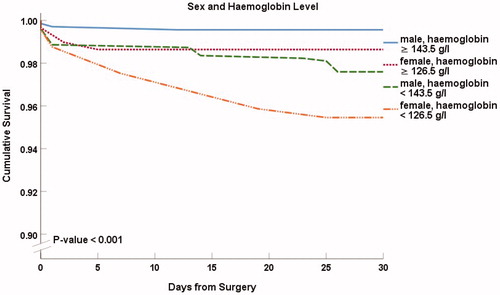
Figure 3. Thirty-day survival according to renal function and the level of haemoglobin. Hb < 143.5 g/l in males and <127.5 g/l in females was considered reduced. eGFR indicates estimated glomerular filtration rate. Kaplan–Meier presentation with p value from the log-rank test.
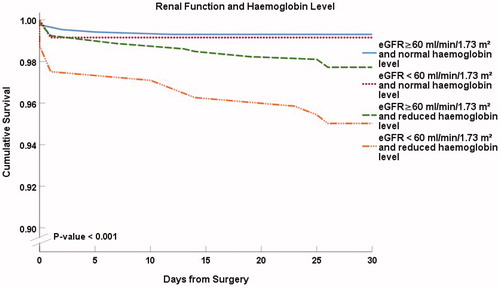
Figure 4. Thirty-day survival according to the presence of preoperative atrial fibrillation and haemoglobin level. Kaplan–Meier presentation with p value from the log-rank test.
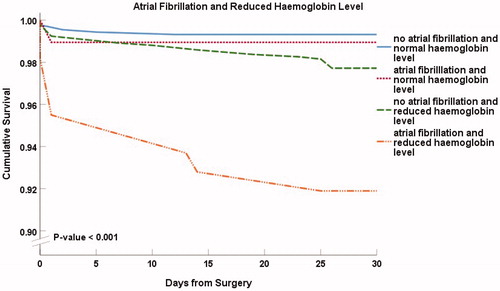
Table 2. Univariate Cox regression model hazard ratios for 30-d mortality.
Table 3. Multivariate Cox regression model hazard ratios (HR) for 30-d mortality risk factors.