Figures & data
Figure 1. The SA-ELISA results of the serum level of β1AR antibodies and expression of biomarkers of PPCM. A. The serum level of β1AR antibodies increases with the increase of immune time (n = 6); B. The mRNA expression of two biomarkers of PPCM increased. **p<.01 (n = 6). Group data presented by mean and SEM.
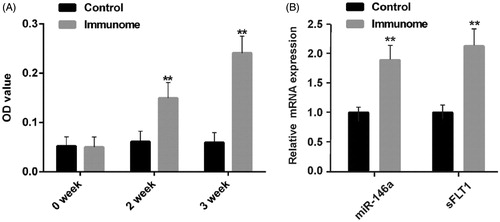
Figure 2. The autoimmune animals had a significant decline in cardiac function. A. Examples of raw data of echocardiography detection from one control animal and immunome model. B. Group data of LVEF, LVFS, LVESD and LVEDD. The left ventricular ejection fraction (LVEF) and left ventricular shortening fraction (LVFS) decreased in immuno group compared with control group from 82.4 ± 2.5 to 72.9 ± 2.3% (n = 6, p<.01) and 52.6 ± 2.9 to 42.9 ± 1.9% (n = 6, p<.05) at second week, and 81.8 ± 1.9 to 66.8 ± 1.1% (n = 6, p < .01) and 51.4 ± 2.1 to 37.7 ± 0.9% (n = 6, p < .01) at third week. While, the left ventricular end-systolic diameter (LVESD) increased compared to the control group from 2.8 ± 0.2 to 3.6 ± 0.2 mm (n = 6, p < .05) at second week and 2.8 ± 0.1 to 3.7 ± 0.1 mm at the third week. *p < .05; **p < .01 (n = 6). Group data presented by mean and SEM.
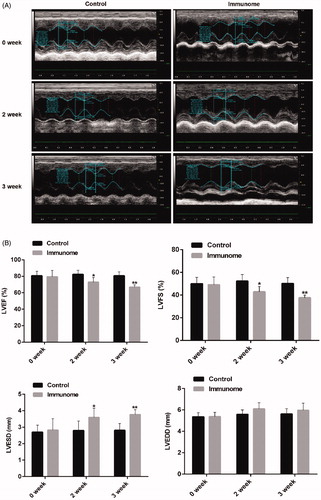
Figure 3. The apoptosis rate of left ventricular myocytes of autoimmune animals increased. A. TUNEL positive nuclei obtained from left ventricular myocardium visualized by fluorescence microscopy. B. Group data of apoptosis rate. **p<.01 (n = 6). Group data presented by mean and SEM. The rate of TUNEL-positive nuclei in left ventricular myocardium significantly increased in the immune group from 0.4 ± 0.4 to 13.4 ± 1.2%. C. HE staining of left ventricular myocardial tissue. Scale bar, 50µm.
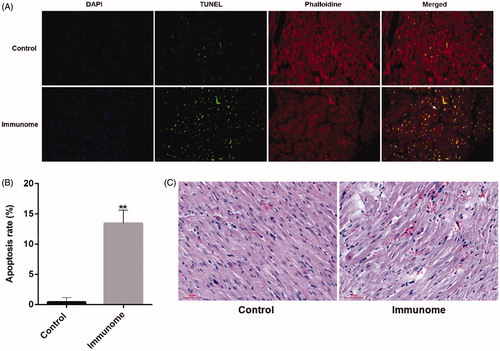
Figure 4. The relative mRNA expression of β1AR and PGC-1α related signal factor and protein expression of downstream signal of β1AR. A. The relative mRNA expression of PGC-1α, PGC-1β and VEGF decreased and the relative mRNA expression of β1AR increased in the immune group (n = 6); B. The β-arrestin 1/2 decreased and PKA activity had no significant difference after immunity (n = 3). **p < .01. Group data presented by mean and SEM.
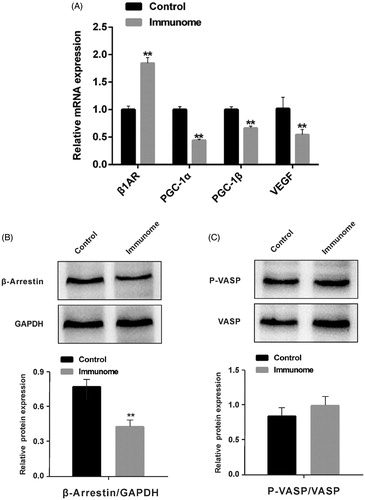
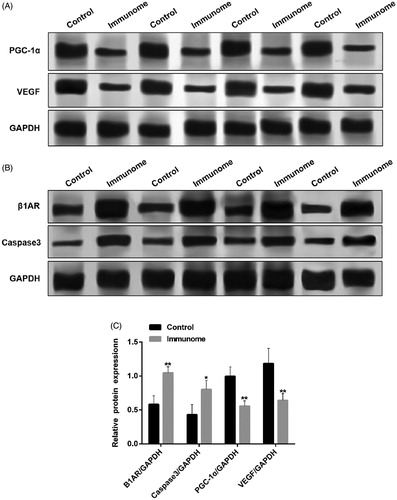
Figure 5. The relative protein expression of PGC-1α, VEGF, β1AR and caspase 3. A and B. Raw data of WB test of PGC-1α, VEGF, β1AR and caspase 3; C. The relative protein expression of β1AR and caspase 3 increased and PGC-1α and VEGF decreased in the immune group (n = 3). p < .05; **p < .01. Group data presented by mean and SEM.