
Figures & data
Table 1. Study population demographics, laboratory and supine hemodynamic values in the heart rate tertiles calculated according to sexes.
Figure 1. Mean (95% confidence intervals) supine and upright heart rate (A), RR-interval (B), and the change in heart rate (C), and RR-interval (D) during passive head-up tilt according to the mean supine heart rate (HR) tertiles; *p < .001, †p < .05 statistically significant differences in the analysis of variance with Tukey’s HSD correction in post-hoc testing.
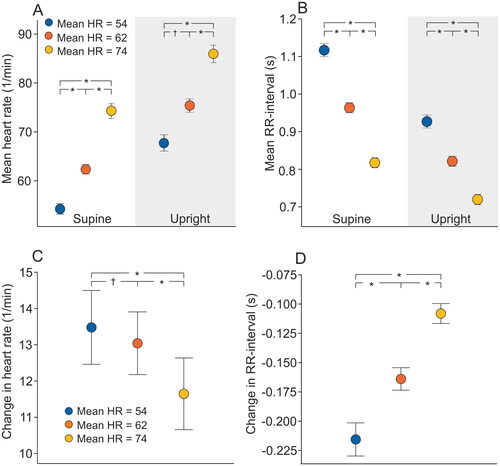
Figure 2. Mean (95% confidence intervals) supine and upright standard deviation of normal-to-normal RR-intervals (SDNN) (A), and the square root of mean squared differences of normal-to-normal RR-intervals (RMSSD) (B) according to the mean supine heart rate (HR) tertiles. Values are presented as natural logarithms (Ln) of the variables to normalize their distributions; *p < .001, †p < .05 statistically significant differences in the analysis of variance with Tukey’s HSD post-hoc test.
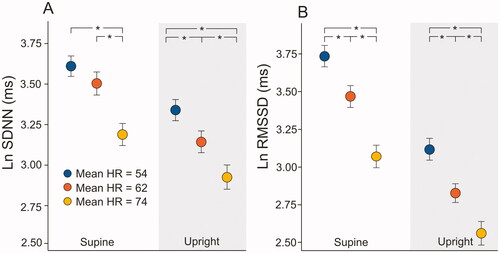
Figure 3. Mean (95% confidence intervals) supine and upright total power (A), low-frequency power (B), high-frequency power (C), and low to high-frequency power ratio (D) according to the mean supine heart rate (HR) tertiles. Values are presented as natural logarithms (Ln) of the variables to normalize their distributions; *p < .001, statistically significant differences in the analysis of variance with Tukey’s HSD post-hoc test.
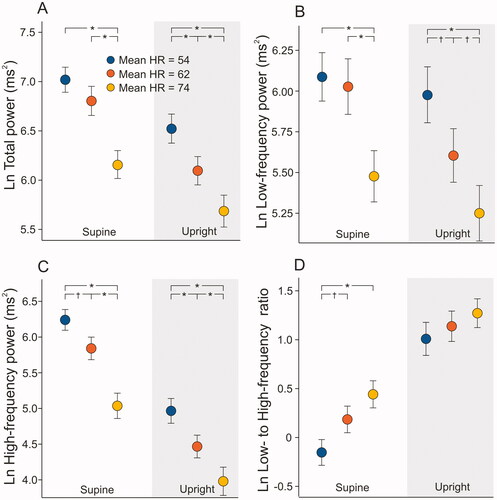
Table 2. Actual heart rate variability values according to resting heart rate tertiles during 3 min measurement at supine and upright position.
Figure 4. Mean (95% confidence intervals) supine and upright total power (A), low-frequency power (B), high-frequency power (C), and low to high-frequency power ratio (D) according to the mean supine heart rate (HR) tertiles. The dependence of heart rate on heart rate variability was weakened by dividing heart rate variability parameters by average RR-intervals to the fourth power [Citation17]. Values are presented as natural logarithms (Ln) of the variables to normalize their distributions; *p < .001, †p < .05 statistically significant differences in the analysis of variance with Tukey’s HSD post-hoc test.
![Figure 4. Mean (95% confidence intervals) supine and upright total power (A), low-frequency power (B), high-frequency power (C), and low to high-frequency power ratio (D) according to the mean supine heart rate (HR) tertiles. The dependence of heart rate on heart rate variability was weakened by dividing heart rate variability parameters by average RR-intervals to the fourth power [Citation17]. Values are presented as natural logarithms (Ln) of the variables to normalize their distributions; *p < .001, †p < .05 statistically significant differences in the analysis of variance with Tukey’s HSD post-hoc test.](/cms/asset/6a4f41f3-8480-4888-87ff-646663b80184/icdv_a_2079713_f0004_c.jpg)
Supplemental Material
Download MS Word (28.4 KB)Data availability statement
The data been used during the present study is not publicly available as our clinical database contains several indirect identifiers and the informed consent obtained does not allow publication of individual patient data. However, the datasets are available from the corresponding author on reasonable request.