
Figures & data
Table 1. Participants and non-participants.
Figure 1. EQ VAS score before and after surgery. Median with interquartile range of EQ VAS scores of the patients’ self-rated health at preoperative, 6- and 12-month evaluations. The improvement of EQ VAS score is better at 6 and 12 months as compared to preoperative score in related-samples Wilcoxon signed rank test.
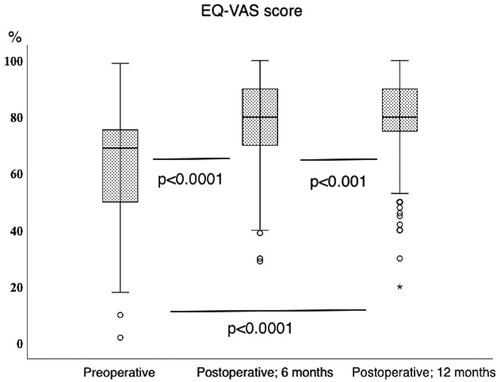
Table 2. Change in the number of patients reporting problems.
Table 3. Results of multivariable logistic regression analysis.