
Figures & data
Table 1. Demographics and comorbiditiesTable Footnote*.
Table 2. Aneurysm morphologyTable Footnote*.
Table 3. Covered stents implanted in target vessels.
Table 4. Major postoperative adverse events.
Table 5. 30-Day spinal cord ischemia.
Figure 1. Survival postoperatively analyzed with Kaplan-Meier statistics. Curves are truncated at 36 months post-EVAR. EVAR: endovascular aortic repair.
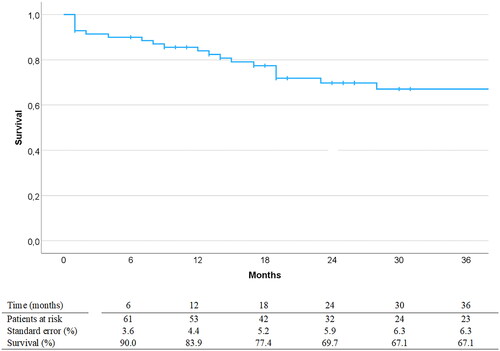
Figure 2. Freedom from aorta-related reintervention postoperatively analyzed with Kaplan-Meier statistics. Curves are truncated at 36 months post-EVAR. EVAR: endovascular aortic repair.
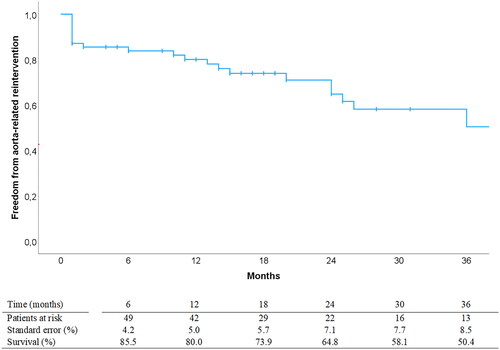
Table 6. Reinterventions during 36 months follow-up.
Table 7. Reasons for failure of primary clinical success.