Figures & data
Table 1. Comparison of baseline data between control and experimental group.
Figure 1. The expression and clinical diagnostic value of BRE-AS1 in AMI. (A) The serum expression level of BRE-AS1 in patients with AMI (data are presented as mean and standard deviation, independent samples t-test was used). (B) ROC curve analysis. The area under the curve (AUC) of ROC curve is 0.868, the sensitivity is 82.70% and the specificity is 81.40%. ***p < .001 vs. control group. BRE-AS1: brain and reproductive organ-expressed protein (BRE) antisense RNA 1; AMI: acute myocardial infarction; ROC: receiver operator characteristic; AUC: area under the curve.
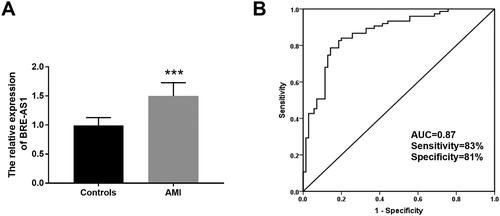
Table 2. Association of different variables with the occurrence of AMI.
Figure 2. Kaplan–Meier’s curves of survival probability of patients with AMI stratified by the serum BRE-AS1 expression levels. BRE-AS1: brain and reproductive organ-expressed protein (BRE) antisense RNA 1; AMI: acute myocardial infarction.
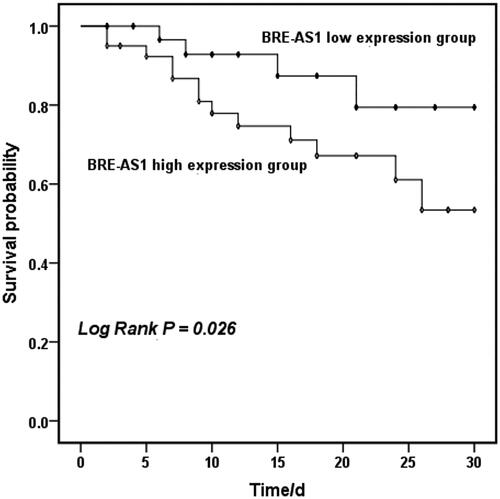
Table 3. Comparison of baseline data between low BRE-AS1 expression group and high BRE-AS1 expression group.
Table 4. Multivariate Cox regression analysis for the overall survival of AMI patients.
Figure 3. The effect of BRE-AS1 on inflammatory response in I/R injury cell model. (A) Effect of transfection of si-BRE-AS1 on intracellular BRE-AS1 expression after I/R treatment. Effect of inhibition of BRE-AS1 on the production of (B) TNF-α, (C) IL-1β and (D) IL-6 in I/R cell models. ***p < .001 vs. control group, ###p < .001 vs. I/R + si-NC group. The values shown are mean and standard deviation, one-way ANOVA was used. BRE-AS1: brain and reproductive organ-expressed protein (BRE) antisense RNA 1; I/R: ischemia/reperfusion; TNF-α: tumor necrosis factor-α; IL-1β: interleukin-1β.
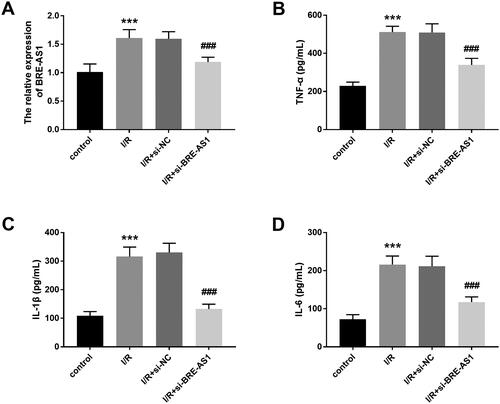
Figure 4. The effect of BRE-AS1 on oxidative stress reaction in I/R cell model. The levels of (A) LDH and (B) MDA in I/R cell model was significantly down-regulated by silencing BRE-AS1 expression. The downregulation of BRE-AS1 increased the concentrations of (C) SOD and (D) GSH-Px in H9c2 cells treated with I/R. ***p < .001 vs. control group, ###p < .001 vs. I/R + si-NC group. The values shown are mean and standard deviation, one-way ANOVA was used. BRE-AS1: brain and reproductive organ-expressed protein (BRE) antisense RNA 1; I/R: ischemia/reperfusion; LDH: lactate dehydrogenase; MDA: malondialdehyde; SOD: superoxide dismutase; GSH-Px: glutathione peroxidase.
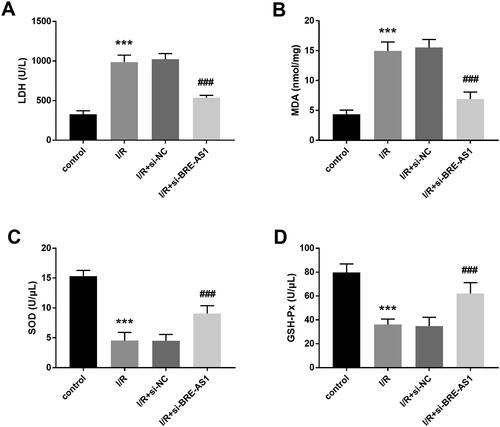
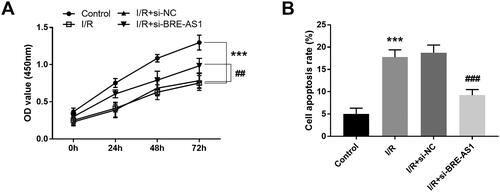
Figure 5. Effect of BRE-AS1 on (A) cell viability and (B) apoptosis in I/R cell model. ***p < .001 vs. control group, ##p < .01, ###p < .001 vs. I/R + si-NC group. The values shown are mean and standard deviation, one-way ANOVA was used. BRE-AS1: brain and reproductive organ-expressed protein (BRE) antisense RNA 1; I/R: ischemia/reperfusion.