
Figures & data
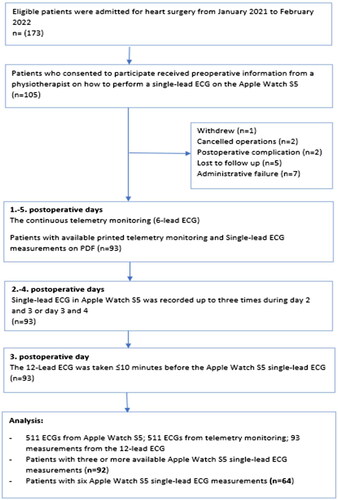
Figure 1. Study flow chart.
Graph 1. Bar graphs with 95% confidence intervals as error bars showing the sensitivity, specificity, positive and negative predictive values of smartwatch ECG compared to telemetry and 12-lead ECG.
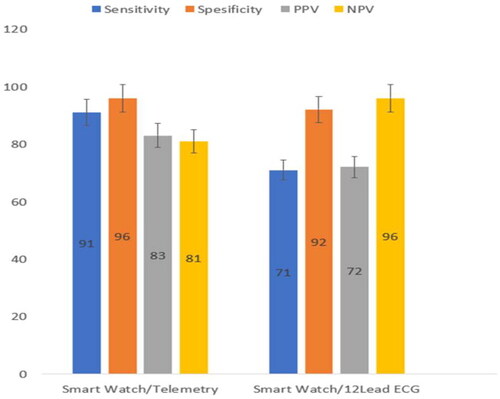
Table 1. Baseline characteristics of the 93 in-hospital participants that had undergone left-sided heart valve surgery.
Table 2. Comparison of Apple Watch atrial fibrillation detection with continuous ECG measurements at given time points.
Table 3. Comparison of Apple Watch atrial fibrillation detection with a 12-lead ECG.
Data availability statement
Data for this article is collected in Service for Sensitive Data (TSD), which is Norwegian platform for collecting, storing, analyzing and sharing sensitive data in Norway. Data can be shared upon reasonable request to the corresponding author.