
Figures & data
Table 1. Demographic and clinical characteristics of suspected coronary artery disease (CAD) patients who were diagnosed with CAD or without CAD (NCAD) through coronary angiography.
Figure 1. Comparisons of parameters of three-dimensional speckle tracking imaging including global longitudinal strain (GLS, a), global area strain (GAS, B), global circumferential strain (GCS, C), and global radial strain (GRS, D) in suspected coronary artery disease (CAD) patients who diagnosed with CAD (n = 142) or without CAD (NCAD, n = 118) through coronary angiography. Data were shown with mean ± SD. ***p < 0.001 from unpaired t-test with Welch’s correction.
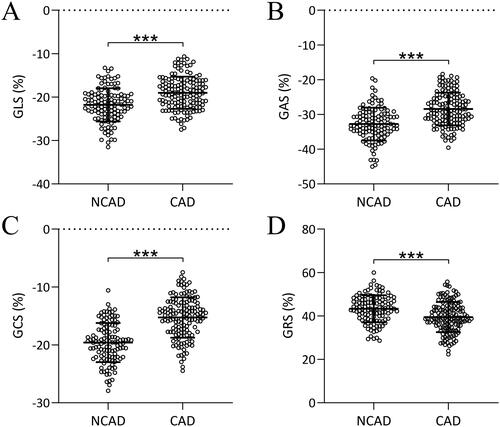
Figure 2. ROC analysis for the diagnostic value of three-dimensional speckle tracking imaging in coronary artery disease.
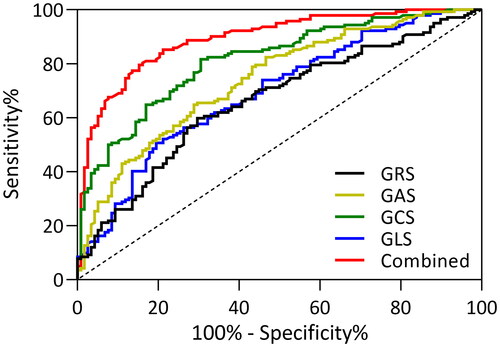
Table 2. Diagnostic values in ROC analysis.
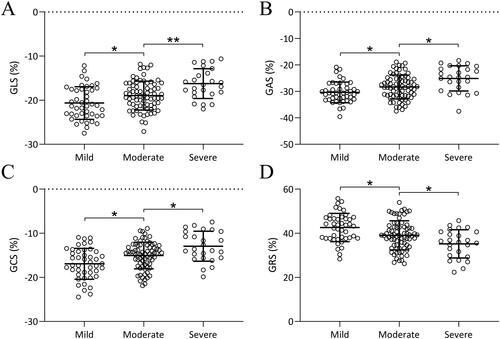
Figure 3. Comparisons of parameters of three-dimensional speckle tracking imaging including global longitudinal strain (GLS, a), global area strain (GAS, B), global circumferential strain (GCS, C), and global radial strain (GRS, D) among patients with different severity of coronary artery disease. Data were shown with mean ± SD. *p < 0.05, **p < 0.01 from Brown-Forsythe ANOVA test followed by Dunnett’s T3 multiple comparisons test.
Supplemental Material
Download MS Word (542.9 KB)Data availability statement
The raw data supporting the conclusions of this article will be made available by the authors, without undue reservation.