
Figures & data
Table 1. Method to test the commensurability of measures of well-being in housing.
Table 2. Method to compare evaluation approaches to housing deprivation.
Table 3. Method for assessing inequality in conversion efficacy.
Table 4. Selected indicators and deprivation cut-offs.
Figure 1. Predictability of the deprivation of basic capabilities for housing by income and of dwelling dissatisfaction by basic capabilities for housing.
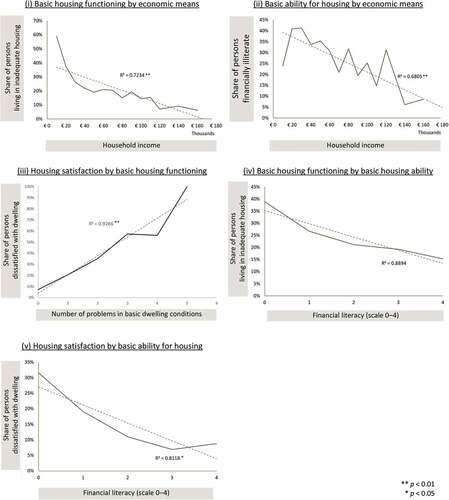
Table 5. Deprivation rates for each indicator.
Table 6. Correlations between the compared measures of well-being in housing.
Table 7. Degree of consistency in identification of deprived persons: a test of in/commensurability.
Table 8. Pairwise comparisons of target group identifications.
Figure 2. Degree of overlap between deprived groups: basic economic means and housing functioning.
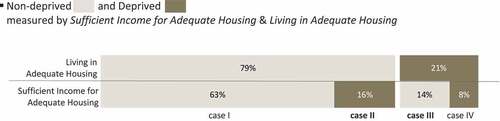
Figure 3. Degree of overlap between deprived groups: housing satisfaction and basic housing functioning.
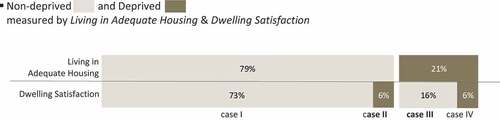
Figure 4. Degree of overlap between deprived groups: basic housing functioning and ability for housing.
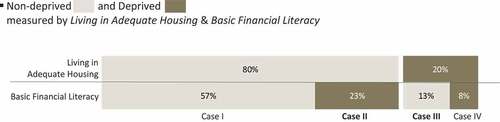
Figure 5. Degree of overlap between deprived groups: basic economic means and ability for housing.
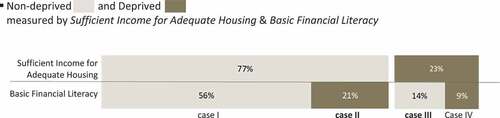
Figure 6. Degree of overlap between deprived groups: housing satisfaction and basic ability for housing.
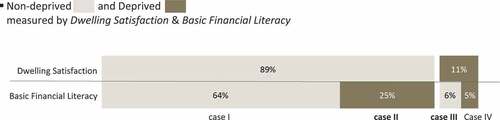
Figure 7. Conversion efficacy by subgroups: from basic economic means to basic housing functioning.
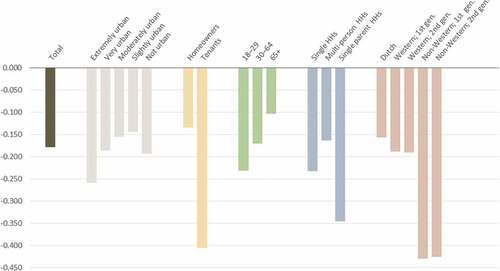
Figure 8. Different degrees of simultaneous deprivations in housing situation among subgroups.
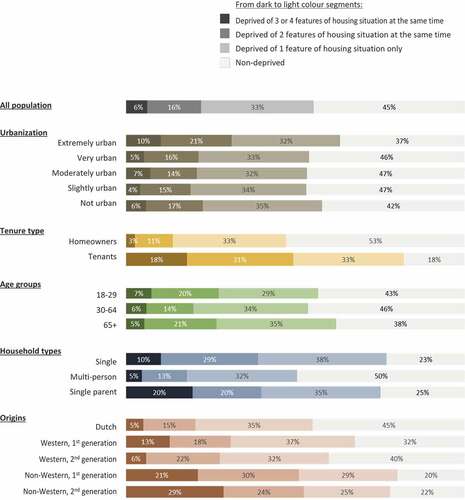
Table A1. Survey questionnaires on financial literacy
Table B1. Incidence of pairwise overlaps and mismatches between measures.
Table B2. Counting-based assessment of inequality in conversion efficacy among subgroups.
Table B3. Degrees of simultaneous deprivations in housing situation by subgroups (%).