
Figures & data
Table 1. Descriptive data on the therapy and participants in the study, N = 43.
Figure 1. Flow charts depicting the recruitment process of the two groups. a) Flowchart of treatment subjects and b) Flowchart of control subjects.
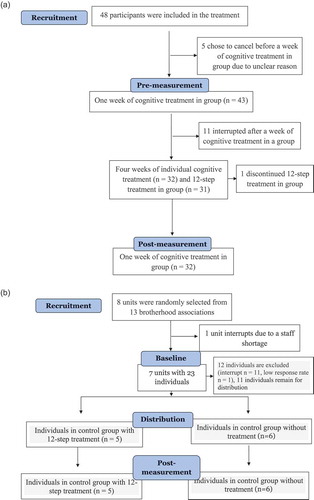
Table 2. Mean (M), standard deviation (SD) and 95% CI of mean regarding criminal thinking patterns for each group before and after..
Figure 2. Mean score of the psychological inventory of criminal thinking styles (PICTS) before and after for the therapy group and the control group. Each mean with ±SE.
Table 3. Mean (M), standard deviation (SD) and 95% CI of mean regarding sense of coherence for each group before and after..
Figure 3. Mean score of the brief version of the sense of coherence scale (SOC-13) before and after for the therapy group and the control group. Each mean with ±SE.
Table 4. Mean (M), standard deviation (SD) and 95% CI of mean regarding positive and negative affect for each group before and after.
Figure 4. Mean score of the PANAS positive affect before and after for the therapy group and the control group. Each mean with ±SE.
Table 5. Correlation matrix for quality of programme delivery, PICTS, SOC and positive affect after treatment, N = 31.