Figures & data
Figure 1. Lithuanian and euro area macro variables.
Figure 2. Responses of euro area variables to the monetary policy shock.
Figure 3. Responses of Lithuanian variables to the monetary policy shock.
Figure 4. Responses of Lithuanian variables to the monetary policy shock (model with NIIP).
Figure 5. Impulse responses to a 100 bp Euribor shock in the absence of reaction in ; model with NIIP.
Figure 6. GDP, consumer prices, credit stock and credit margins in the Baltic states during 2002–2014.Footnote20
Figure 7. Impulse responses to a 100 bp Euribor increase in the panel and Lithuanian VAR models.
Figure 8. Industry structure in the Baltics: shares of gross value added during 2002–2014.
Figure 9. Rolling window estimates of responses to a 100 bp Euribor shock.
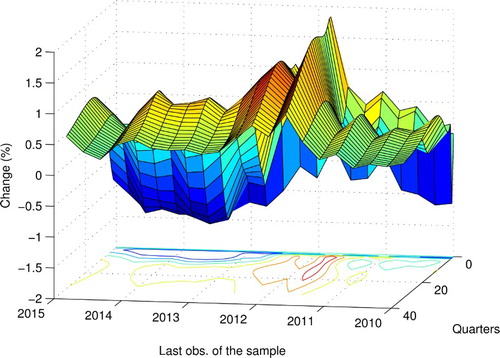
Figure 10. Rolling window estimates of responses to a 100 bp Euribor shock.
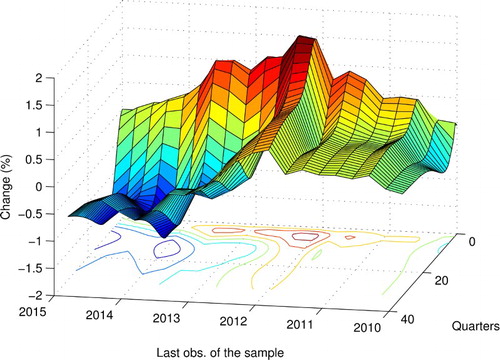
Figure 11. Rolling window estimates of responses to a 100 bp Euribor shock.
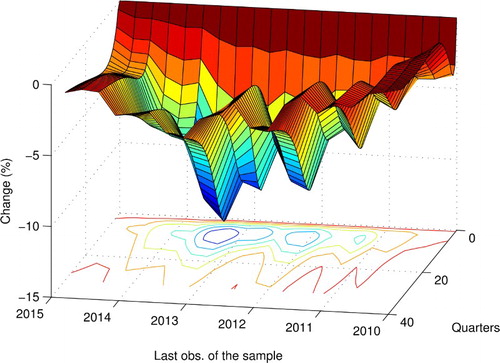
Table A1. Data description.
Figure A1. Lithuanian variables' responses to a 100 bp Euribor shock based on the model with Lithuanian block estimated in levels.