Figures & data
Table 1. EU-SILC summary statistics for 2015 income reference year.
Figure 1. The Gini coefficients of equivalised disposable income in all EU-SILC countries. Household disposable income is equivalised by the OECD-modified scale. Confidence intervals are estimated by using Rao et al. (Citation1992) bootstrap methodology. Information on survey design is provided by Goedemé (Citation2013) and Zardo and Goedemé (Citation2016).
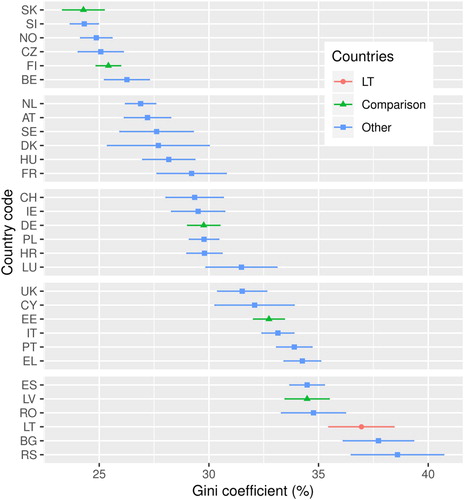
Table 2. Income inequality measures under different equivalence scales.
Table 3. Ratios of average subgroup incomes in 2015.
Table 4. Ratios of average subgroup incomes in Lithunia.
Table 5. The Gini coefficient of income of subgroups in 2015.
Table 6. Gini of subgroup incomes in Lithuania.
Table 7. Stratfication of subgroup income in 2015.
Table 8. Stratfication of subgroup incomes in Lithuania.
Table 9. Decomposition of the Gini coefficient in 2015.
Table 10. Decomposition of the first differences of the Gini coefficient of equivalised disposable income in Lithuania in 2015.
Table 11. Factor decomposition of the Gini coefficient in 2015 by labour, capital, transfers, taxes and their sub-factors.
Table 12. Factor decomposition of the of Gini of disposable income in 2015.
Table 13. Marginal decomposition of the Gini coefficient in 2015 by labour, capital, transfers, taxes and their sub-factors.
Table 14. Progressivity index for market incomes in 2015.
Table 15. Progressivity index for market incomes in 2015 for self-employed.
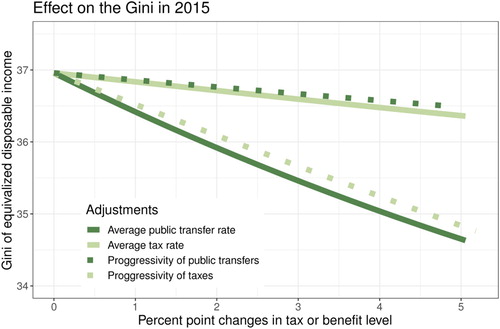
Figure 2. Simulating the effect of changes in progressivity and average rate of tax and public transfers on the Gini coefficient of equivalised disposable income in Lithuania.