Figures & data
Figure 1. Output Cycles and Euro Accession, 1995–2018. Black line = Hodrick-Prescott filtered log real output; grey line = unfiltered values (scaled to cycle range). Black dashed line = Euro accession; grey dashed line = ERM-II membership (Slovakia and Slovenia)
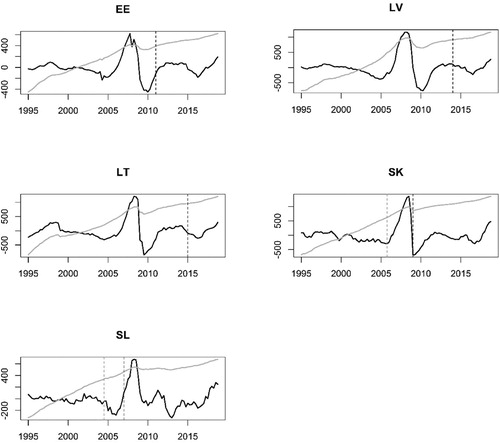
Figure 2. Log Changes, Real Expenditure Series, 1995–2018. Solid grey line = Real output; solid black line = real consumption; dotted line = real investment.
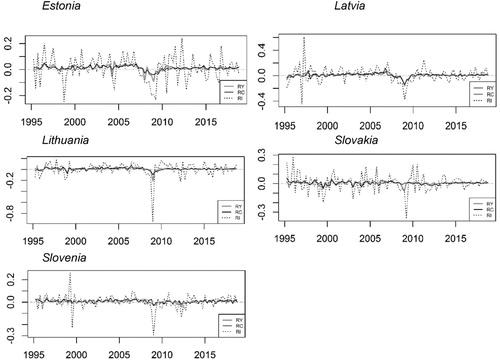
Figure 3. Alternative Volatility Measures, Latvian Output, 1995–2018. Solid line = SD4; dashed line = MAD4.
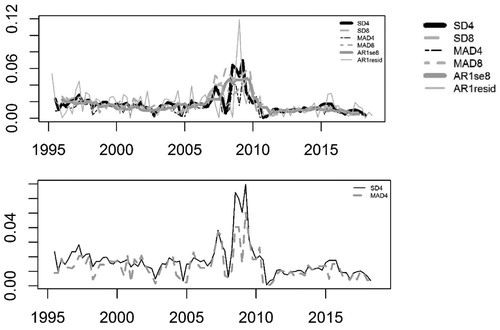
Table 1. Correlations Among Alternative Volatility Measures, Latvian Output.
Figure 4. Volatility Measures and Structural Breaks. Dark dashed lines: Euro accession date (and ERM initiation for Slovakia and Slovenia). Other dashed lines = structural breaks (vertical) and subperiod means (vertical).
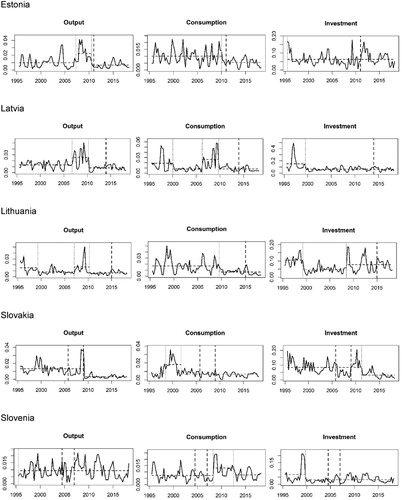
Table 2. Breakdates for Each Volatility Series.
Table 3. Means by Subperiod and Tests for Group Differences.
Figure 5. Trade Openness Measures (Exports plus Imports as Share of GDP). Dark dashed line: Euro accession date. Other dashed lines = structural breaks (vertical) and subperiod means (vertical). ERM membership shown for Slovakia (November 2005) and Slovenia (June 2004).
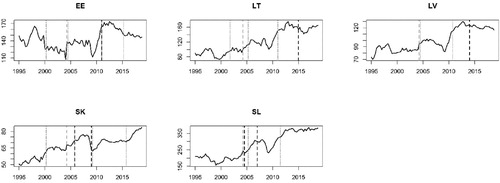
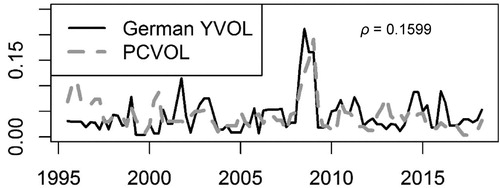
Figure 6. External Volatility Measures.