
Figures & data
Table 1. Share of firms in manufacturing, trade and business services, who viewed that credit access problem in 2010–2013 (as described in the credit accessibility questions) was relevant or very relevant, %.
Table 2. Principal component analysis of the credit difficulty measures.
Figure 1. Country averages of credit difficulty index and box-plot analysis of firm level variation.
Note: Sample is restricted to manufacturing, trade and business service firms.
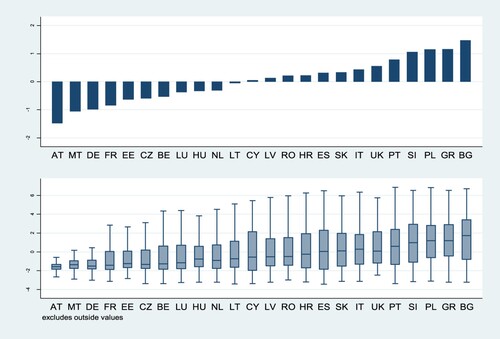
Figure 2. Histogram of credit difficulty index.
Note: Sample is restricted to manufacturing, trade and business service firms. Data weighted to reflect an overall employment in the country.
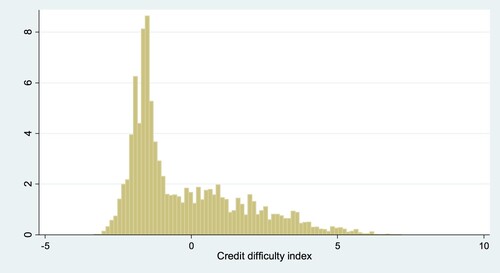
Figure 3. Correlations of the results of SAFE survey on firms and BLS on banks, and index of credit difficulties.
Note: Panel a: Safe survey, share of firms reporting credit availability as the more pressing problem and index of credit difficulty (mean values for each country). Panel b: BLS survey, share of banks reporting a tightening in conditions and index of credit difficulty (mean values for each country).
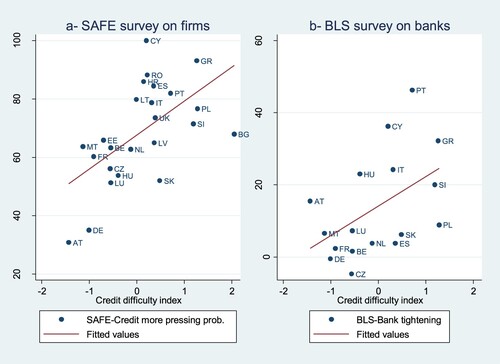
Figure 4. Correlations between adjustments in employment (total hours worked, panel (a) and nominal hourly wages (panel b) and index of credit difficulties).
Note: National accounts (Private sector only) and index of credit difficulty (mean values for each country).
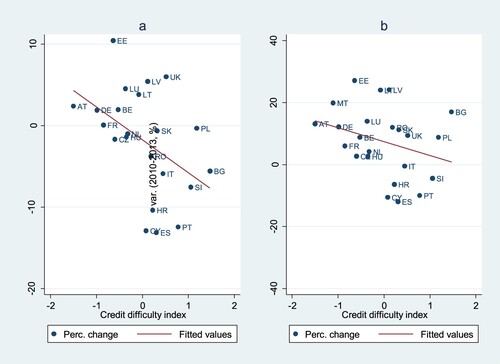
Table 3. Labour input adjustments and credit availability. Probit marginal effects.
Table 4. Labour input adjustments and credit availability (robustness check). Probit marginal effects.
Table 5. Labour input adjustments and credit availability, by detailed method of adjustment. Probit marginal effects.
Table 6. Wage adjustments and credit availability, base wage and variable wage components. Probit marginal effects.
Table 7. Credit availability and labour market adjustments by type of firm. Probit marginal effects.
Table 8. Credit availability and labour market adjustments by geographical area. Probit marginal effects.
Table 9. Credit availability and labour market adjustments by country. Probit marginal effects.
Figure 5. Correlations between the change in credit supply and the index of credit difficulties.
Note: Credit supply (measured on credit registers and normalized between zero and one in both countries) and index of credit difficulty.
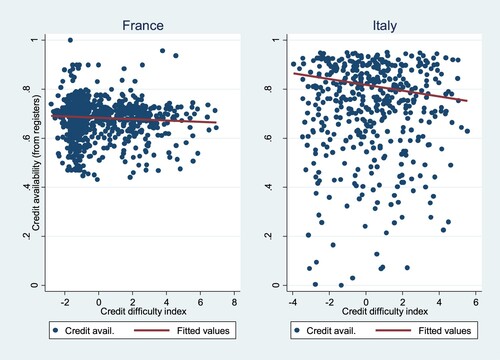
Table 10. Italy and France. Alternative index of credit supply and labour market adjustments. Pooled data.
Table A1. Survey sample by country, sector and size (firms that provided answers about credit availability).
Table A2. List of the WDN3 questions used in this paper.
Table A3. Share of firms in manufacturing, trade and business services, who reported need to reduce labour input or alter its composition; and use of labour adjustment measures by corresponding firms, %.