
Figures & data
Figure 1. The European skill space and its construction.
Notes: A) The data for the skill space is constructed by matching the ESCO data on skill intensity in occupations (1a) and EU-LFS data on employment shares of occupations (1b), resulting in a skill-complementarity matrix (3) which captures the co-occurrence of skills across occupations. B) The skill space is visualized as a network structure based on the skill complementarity φ using only edge weights, representing skill similarity, greater than 0.4. The visualization reveals two large community clusters of complementary skills. The colouring reflects ESCO level 1 skill categories. Node size represents the skill's centrality, that is the shared similarity of that skill and all other skills.
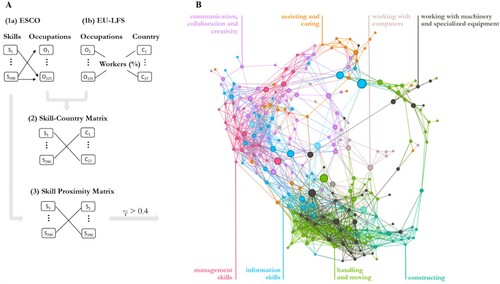
Figure 2. Different patterns of skill specialization in 2011 and 2018: A) 2011: B) 2018.
Notes: Skill specialization can take three different shapes, with strong specialization in. a. socio-cognitive skills (Belgium, Switzerland, Denmark, Ireland, Iceland, Luxemburg, Norway, The Netherlands, Sweden, UK). b. sensory-physical skills (Czech, Spain, Italy, Croatia, Hungary, Portugal, Romania, Slovakia). c. entire skill space (Austria, Cypress, Germany, Estonia, Finland, France, Greece, Lithuania, Latvia). Filled nodes (black) represent the skills in which the given country has a comparative advantage, that is the skills which are used more than expected on average. Empty nodes (white) are skills in which the given country does not specialize.
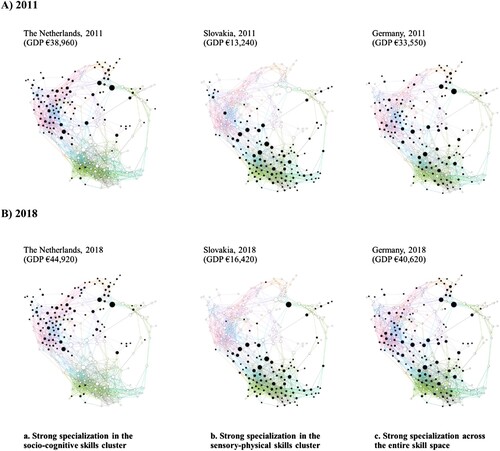
Figure 3. Comparison of Czech Republic and Estonia, 2018.
Notes: Filled nodes (black) represent the skills in which the given country has a comparative advantage, that is the skills which are used more than expected on average. Empty nodes (white) are skills in which the given country does not specialize.
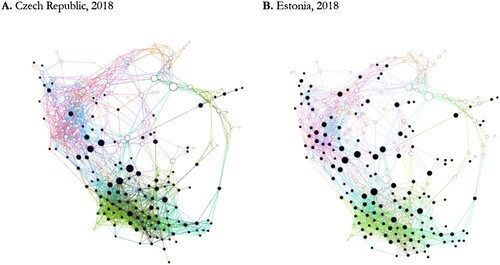
Table 1. Regional skill specialization based on the quantity of comparative advantages in 2018.
Figure 4. Average centrality of all skills in which the country has a comparative advantage.
Notes: The bubble size indicates the amount of comparative advantages in skills that a country has.
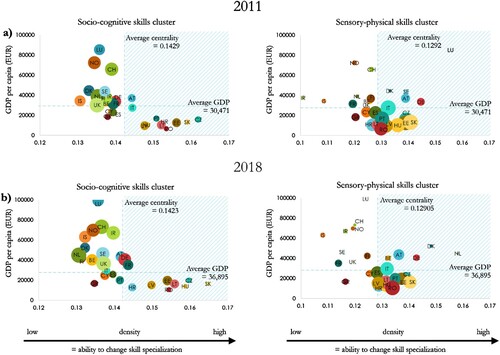
Figure 5. Probability of diversifying into a new skill at t + 1 based on the skill density at t.
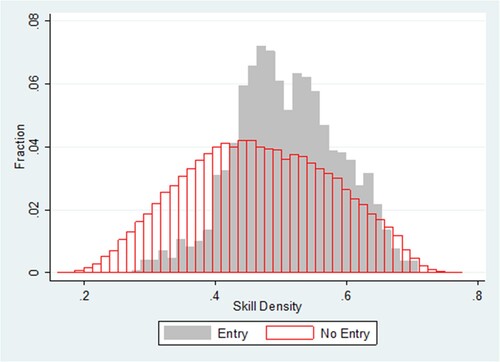
Table 2. Econometric results for the estimation from skill density based on skill space.
Table 3. Econometric results for the estimation from skill density based on skill space, by skill groups.
Table 4. Econometric results for the relationship between economic complexity and skill specialization.
Table
Table
Data availability statements
The skill data that support the findings of this study are available from European Skills, Competences, Qualifications and Occupations (ESCO) database, https://ec.europa.eu/esco/portal/download, and EU Labour Force Survey (LFS) database https://ec.europa.eu/eurostat/web/lfs. Country-specific control variables are from Feenstra, Robert C., Robert Inklaar and Marcel P. Timmer (2015), ‘The Next Generation of the Penn World Table’ American Economic Review, 105(10), 3150–3182, available for download at www.ggdc.net/pwt.