Figures & data
Figure 1. Treatment protocol. An assessment of disease activity score in 28 joints based on erythrocyte sedimentation rate performed at week 24 of golimumab (GLM) treatment. If the patient had moderate or high disease activity, the GLM dose was increased to 100 mg/month. If the patient had LDA or achieved remission, treatment with GLM 50 mg/month was continued.
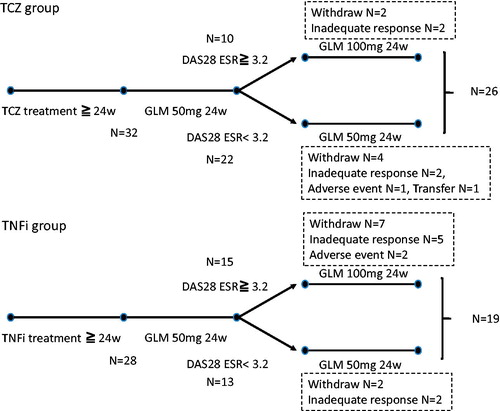
Figure 2. Changes in disease activity as determined by the disease activity score in 28 joints based on erythrocyte sedimentation rate. The tocilizumab (TCZ) and tumor necrosis factor inhibitor (TNFi) groups showed significant improvement at week 24 after the start of treatment with golimumab (GLM). The TCZ group showed significantly better improvement at week 52 of GLM treatment. *p < 0.05; NS, not statistically significant.
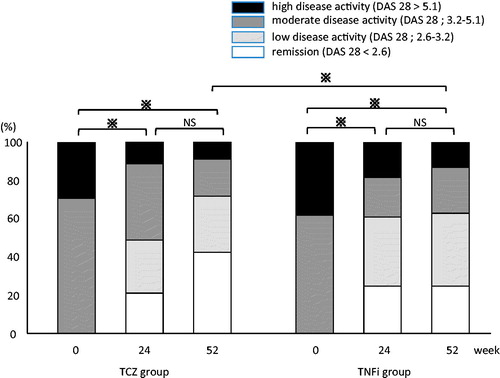
Table 1. Baseline characteristics of patients with RA who switched from TNFi or TCZ.
Figure 3. European League Against Rheumatism response criteria. Both groups showed favorable improvement rates, but no significant difference was found in improvement rate at week 52. p < 0.05; NS, not statistically significant.
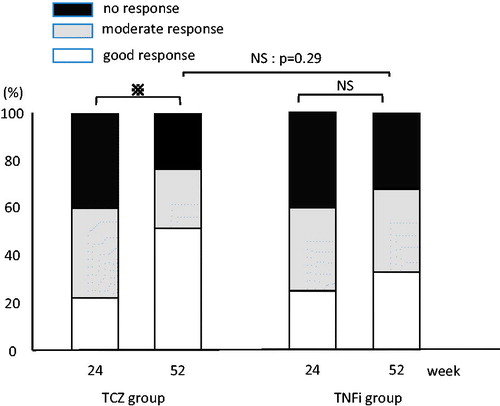
Figure 4. Changes in the mean serum matrix metalloproteinase-3 (MMP-3) levels after the start of golimumab (GLM) treatment; MMP-3 levels decreased over time after the start of GLM treatment in the tocilizumab (TCZ) and tumor necrosis factor inhibitor (TNFi) groups, but no significant intergroup difference was noted in the MMP-3 levels at week 52. Because the reference value of MMP-3 varies by sex, the mean serum MMP-3 levels of each group were graphed separately for men and women and statistically processed. NS, not statistically significant.
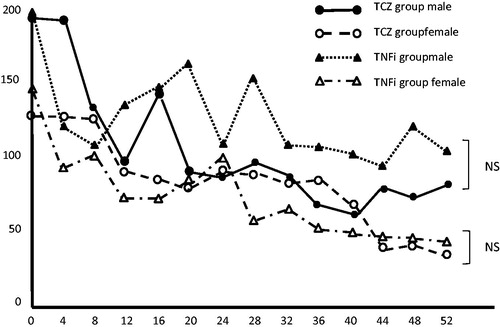
Figure 5. Cumulative probability plot of change in the van der Heijde modified total Sharp scoring system score (mTSS) from baseline to week 52. There was no significant difference in median change between the tocilizumab (TCZ) and tumor necrosis factor inhibitor (TNFi) groups.
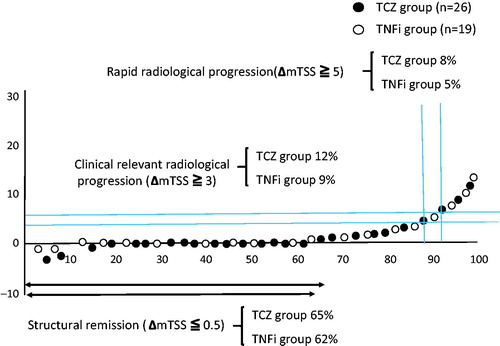
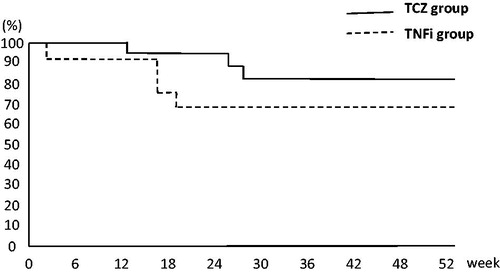
Figure 6. Kaplan–Meier curves of retention rates among patients with rheumatoid arthritis over 52 weeks of golimumab (GLM) treatment. The probability of treatment retention in the tocilizumab (TCZ) group was significantly higher than that in the tumor necrosis factor inhibitor (TNFi) group (p = 0.03).