
Figures & data
Figure 1. (a) Contrast-enhanced CT (axial image), (b) Contrast-enhanced CT (coronal image), (c) MRI; T2-weighted image (coronal image), and (d) Ultrasonographic image. Contrast-enhanced CT shows well-demarcated mass lesion in the antrum of the stomach (a: arrows). Reflecting the submucosal location of the lesion, gastric mucosa is described as strongly enhanced layer between the gastric lumen and mass lesion (b: arrow). The mass lesion shows homogeneous low intensity in MRI, and spared gastric mucosa is revealed as linear high intensity (c: arrows). In ultrasonography, the mass is described as homogeneous low echoic lesion and normal gastric mucosa is described as high echoic layer (d: arrows).
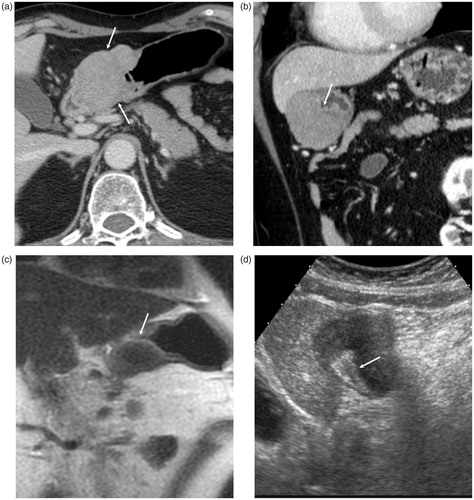
Figure 2. (a) Barium examination, (b) endoscopic image. Gastric lesion is described as compression of the gastric lumen (a: arrows) and submucosal mass projecting into the lumen at the antrum (b). Overlaying mucosa is normal on each examination.
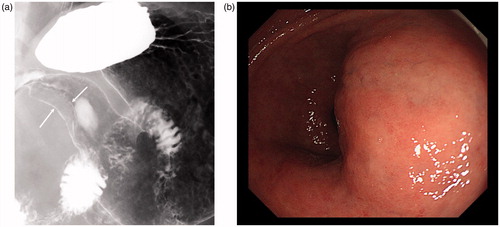
Figure 3. Histopathological specimens of the resected gastric lesion (a–d): H&E staining, (e): Elastica-van Gieson staining, and (f): IgG4 staining. Resected mass is located in the submucosa extending to sub serosal region, and overlaying mucosa is preserved (a: arrows). The mass consists of diffuse lymphoplasmacytic infiltration (b), eosinophils (c: arrows), and dense fibrosis (d). Obliterative phlebitis is also noted (e). In immunostaining of IgG4, abundant IgG4-positive plasma cells are noted.
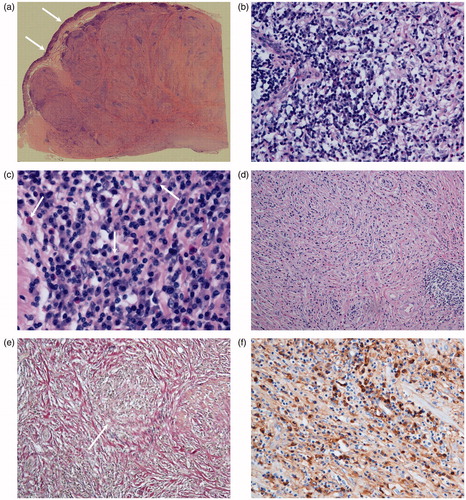
Table 1. Summary of reported cases of IgG4-related gastric lesion.