
Figures & data
Figure 1. Study design and patient disposition for Japanese subgroup. EE: easy escape; CO: crossover.
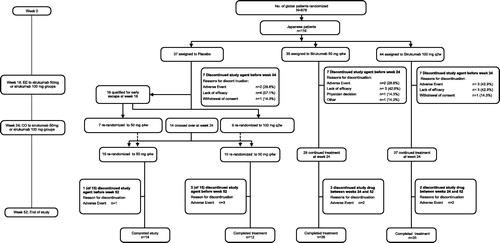
Table 1. Demographic and baseline characteristics.
Figure 2. Proportion of patients who achieved an ACR 20 and ACR 50 response over time (Efficacy full analysis set). aThe confidence intervals are based on the Wald statistic; bThe p values are based on the CMH test. ACR: American college of rheumatology; CI: confidence interval.
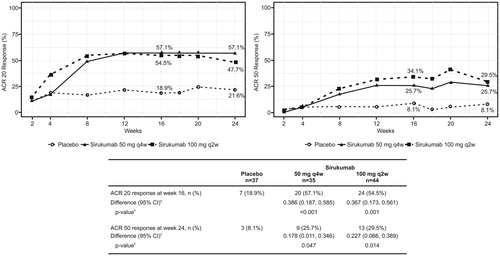
Table 2. Summary of secondary efficacy endpoints through week 24 (full analysis set).
Table 3. Summary of treatment-emergent adverse events (safety analysis set).
Supplemental material