Figures & data
Figure 1. Patient disposition. aReasons for unavailability are: tightening of regulations for facility visits (n = 2), patient was found to be ineligible (n = 1), patient was referred to another facility (n = 1). bFour patients of ‘Indeterminate due to a lack of data before or after administration’ also fall under ‘Patients with less than 2 weeks of administration’.
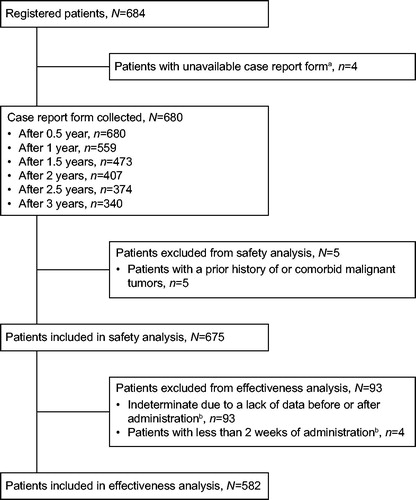
Table 1. Demographic and baseline characteristics of patients participating in the safety analysis.
Table 2. Proportion of adverse drug reactions (occurring in ≥10 patients [≥1.5%]) and serious adverse drug reactions (occurring in ≥3 patients [≥0.4%]).
Table 3. Timing of occurrence of malignancies (adverse events).
Figure 2. Kaplan–Meier plot of (a) adverse drug reactions, (b) serious adverse drug reactions, (c) continued administration. Discontinuations are shown as thin vertical lines.
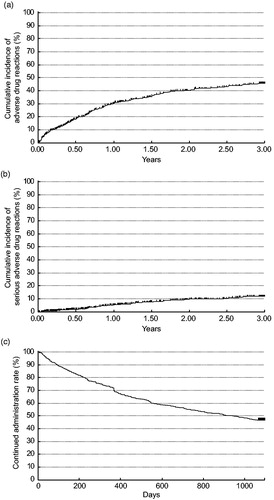
Table 4. Hazard ratios for adverse drug reactions, serious adverse drug reactions, infectious disease, and serious infectious disease by Cox proportional hazard model.
Figure 3. Change in EULAR DAS28-4/ESR response over 2 years. DAS28: Disease Activity Score in 28 joints; ESR: erythrocyte sedimentation rate.
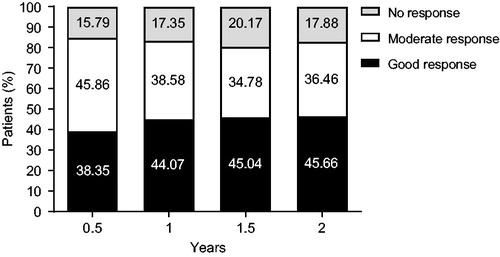
Figure 4. Change in secondary endpoints over 2 years in (a) DAS28-4/ESR and DAS28-3/ESR; (b) DAS28-4/CRP and DAS28-3/CRP; (c) mHAQ score; (d) VAS fatigue score. * p < .001; CRP: C-reactive protein; DAS28: Disease Activity Score in 28 joints; ESR: erythrocyte sedimentation rate; mHAQ: modified Health Assessment Questionnaire; VAS: visual analog scale.
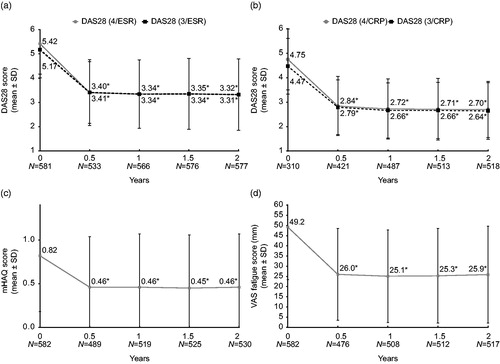
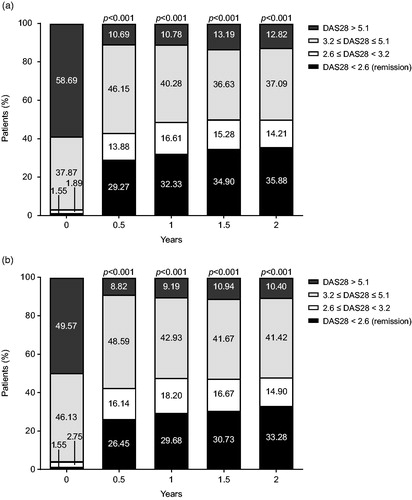
Figure 5. Change in (a) DAS28-4/ESR and (b) DAS28-3/ESR activity over 2 years. DAS28: Disease Activity Score in 28 joints; ESR: erythrocyte sedimentation rate.