
Figures & data
Figure 1. SAA synthesis and pathogenesis of AA amyloidosis. IL-6: interleukin-6; TNF: tumor necrosis factor; IL-1: interleukin-1; SAA: serum amyloid A; AA: amyloid A.
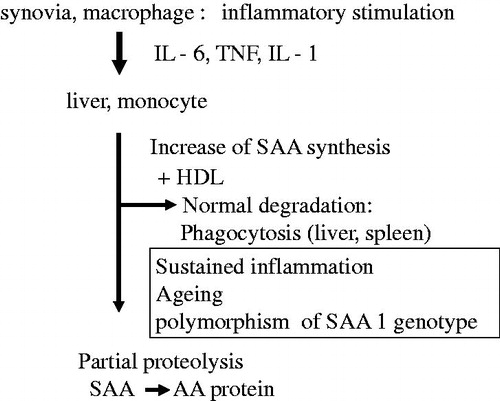
Figure 2. Treatment strategies for AA amyloidosis. SAA: serum amyloid A; IL-6: interleukin 6; TNF: tumor necrosis factor; IL-1: interleukin 1; JAK: Janus kinase; GAG: glycosaminoglycan.
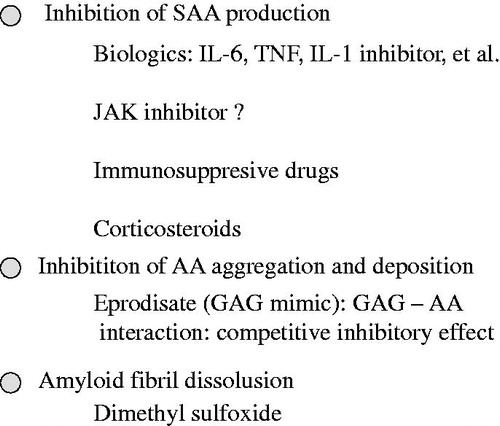
Figure 3. Results of endoscopic examinations before and after IL-6 inhibitor therapy. (a) Before tocilizumab therapy, the appearance of the mucosa in the antrum of the stomach was coarse with reddish and edematous changes. (b) Before tocilizumab therapy was initiated, the appearance of the mucosa in the second portion of the duodenum was coarse, nodular, irregular, edematous, and reddish. (c, d) After 18 months of tocilizumab therapy, no abnormality was observed in the antrum of the stomach or in the second potion of the duodenum (quoted from Okuda et al. [Citation6]).
![Figure 3. Results of endoscopic examinations before and after IL-6 inhibitor therapy. (a) Before tocilizumab therapy, the appearance of the mucosa in the antrum of the stomach was coarse with reddish and edematous changes. (b) Before tocilizumab therapy was initiated, the appearance of the mucosa in the second portion of the duodenum was coarse, nodular, irregular, edematous, and reddish. (c, d) After 18 months of tocilizumab therapy, no abnormality was observed in the antrum of the stomach or in the second potion of the duodenum (quoted from Okuda et al. [Citation6]).](/cms/asset/14eeca83-3067-4a5c-9add-4d05b70d3d58/imor_a_1515145_f0003_c.jpg)
Figure 4. Results of gastrointestinal biopsy before and after IL-6 inhibitor therapy. (a) Massive amyloid A protein deposits were observed in the duodenal mucosa and submucosa before the start of tocilizumab therapy. (b) The marked regression of amyloid A protein deposits was observed in the duodenal mucosa and submucosa after the tocilizumab treatment (Congo red stained; 200× magnification) (quoted from Okuda et al. [Citation6]).
![Figure 4. Results of gastrointestinal biopsy before and after IL-6 inhibitor therapy. (a) Massive amyloid A protein deposits were observed in the duodenal mucosa and submucosa before the start of tocilizumab therapy. (b) The marked regression of amyloid A protein deposits was observed in the duodenal mucosa and submucosa after the tocilizumab treatment (Congo red stained; 200× magnification) (quoted from Okuda et al. [Citation6]).](/cms/asset/2bc89ed2-e46b-459f-9dde-21dd1dac40de/imor_a_1515145_f0004_c.jpg)
Figure 5. Changes in SAA values at treatment initiation and in the last observation. Tocilizumab suppressed SAA values significantly more than the TNF inhibitor (p = .0194, Wilcoxon’s rank-sum test) (quoted from Okuda et al. [Citation12]).
![Figure 5. Changes in SAA values at treatment initiation and in the last observation. Tocilizumab suppressed SAA values significantly more than the TNF inhibitor (p = .0194, Wilcoxon’s rank-sum test) (quoted from Okuda et al. [Citation12]).](/cms/asset/df6d62e9-a333-4357-866a-92dad87463ca/imor_a_1515145_f0005_b.jpg)
Figure 6. Changes in the estimated glomerular filtration rate (eGFR). Improvements in eGFR were observed in 16 patients (72.7%) in the tocilizumab group and 11 patients (34.4%) in the TNF inhibitor group. Although the tocilizumab treatment was initiated at a more advanced stage of renal dysfunction, significant improvements in renal function were obtained (p = .0062, Wilcoxon’s rank-sum test) (quoted from Okuda et al. [Citation12]).
![Figure 6. Changes in the estimated glomerular filtration rate (eGFR). Improvements in eGFR were observed in 16 patients (72.7%) in the tocilizumab group and 11 patients (34.4%) in the TNF inhibitor group. Although the tocilizumab treatment was initiated at a more advanced stage of renal dysfunction, significant improvements in renal function were obtained (p = .0062, Wilcoxon’s rank-sum test) (quoted from Okuda et al. [Citation12]).](/cms/asset/1097b66b-cf24-4f7f-8d24-79efa27363b0/imor_a_1515145_f0006_b.jpg)
Table 1. Biologic treatment and efficacy in AA amyloidosis.