Figures & data
Figure 1. A variety of contrast-enhanced computed tomography (CT) findings in IgG4-related kidney disease. (A) Multiple low-density lesions in the bilateral kidneys (arrows); (B) Diffuse patchy involvement of the bilateral kidneys; (C) Rim-like lesion of the kidney (arrows); (D) Renal pelvis thickening with smooth intraluminal surface (arrows).
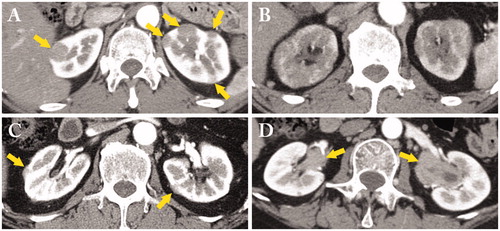
Figure 2. Light microscopy findings in IgG4-related tubulointerstitial nephritis. (A) Copious plasma cell infiltrates in the interstitium (CD138 immunostaining × 100); (B) Many IgG4-positive plasma cell infiltrates with germinal center in the subcapsular interstitium (IgG4 immunostaining ×200); (C) a representative example of storiform fibrosis (periodic acid-methenamine-silver staining ×100); (D) Many eosinophil infiltrates in the interstitium (hematoxylin and eosin staining ×400).
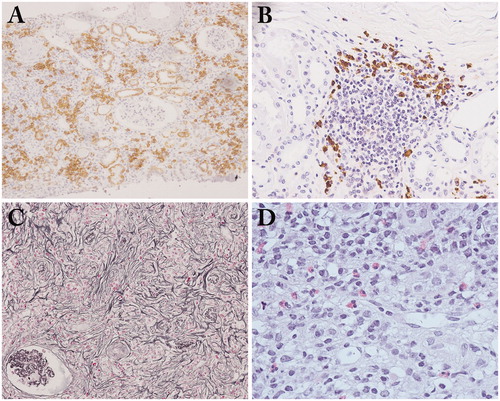
Figure 3. The specific distribution of renal parenchymal lesions. (A) The margin between affected and unaffected areas is very clearly demarcated (periodic acid-methenamine-silver staining ×40); (B) Lymphoplasmacytic cells infiltrate into and beyond the renal capsule (arrow: renal capsule) (periodic acid-methenamine-silver staining ×40).
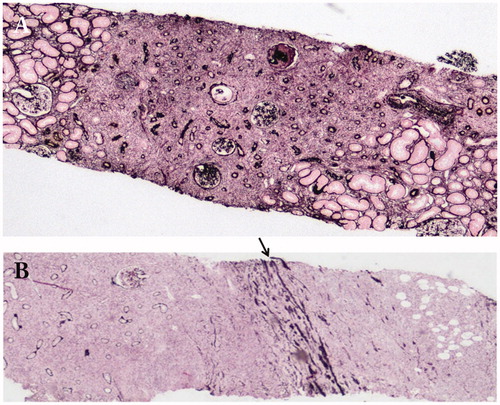
Figure 4. Immunofluorescence findings. (A) Granular deposits of C1q in the tubular basement membrane (×200); (B) Granular deposits of IgG4 in the glomerular basement membrane in IgG4-related membranous glomerulonephritis (×400).
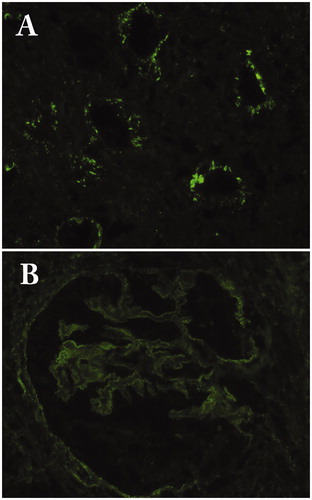
Figure 5. Immunofluorescence findings of the glomerulus in a patient with IgG4-related membranous glomerulonephritis. (A) IgG1; (B) IgG2; (C) IgG3; (D) IgG4.
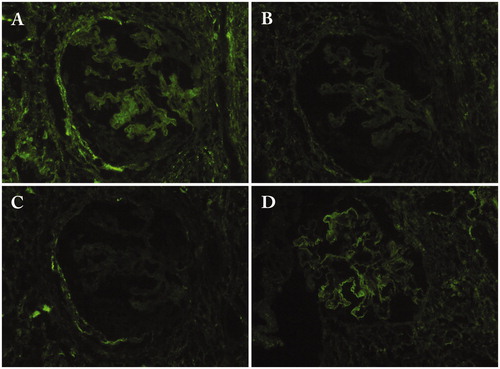
Figure 6. Periarterial lesion and perineural lesion. (A) Marked periarterial fibrosis of interlobar artery (periodic acid-Schiff staining); (B) IgG4-positive plasma cell infiltration in the perineural lesion in a patient with IgG4-ureteritis who underwent nephrectomy (IgG4 immunostaining ×400).
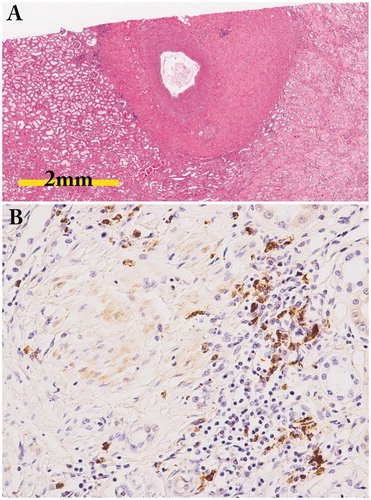
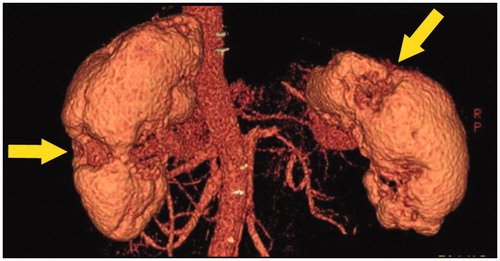
Figure 7. Three-dimensional CT findings. Multiple partially severely atrophied areas (arrows) were seen despite relatively preserved renal function.