Figures & data
Figure 1. Thermography image of the hand of an SSc patient. Patients with SSc have poor peripheral blood flow and have a constantly low hand temperature. In this picture, the skin temperature is under 26 °C in the area where the cross cursor is pointed.
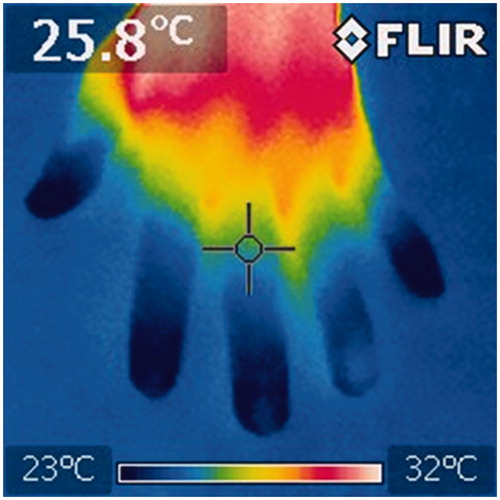
Figure 2. Chest CT images of a patient with SSc. The coronal view presents sclerotic change, especially in the lower lung field (A). The axial mediastinum setting presents enlarged esophagus on the left side of the trachea (white arrow) (B).
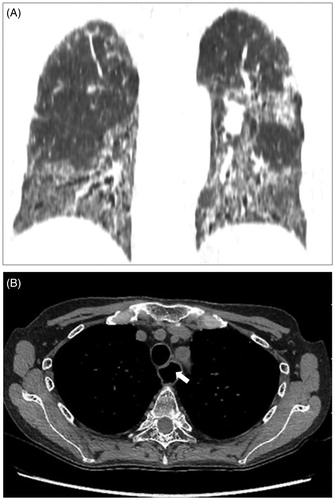
Figure 3. Abdominal X-ray image of an SSc patient with SIBO. The storage of gas in the intestinal tract is observed throughout the abdomen. SSc: systemic sclerosis; SIBO: small intestinal bacterial overgrowth.
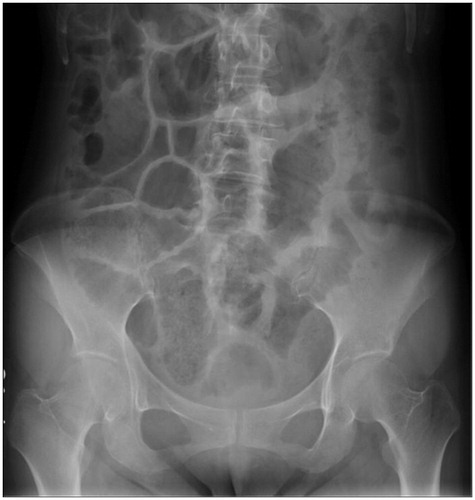
Figure 4. The relationship between disease duration and baseline IL-6 concentration, and between baseline IL-13 concentration and decreased count of mRSS after TCZ treatment. There were patients with a higher IL-6 level among those with a shorter disease duration. The patients showing higher decreases in mRSS counts during the TCZ treatment had lower levels of IL-13. mRSS: modified Rodnan skin score; IL-6: interleukin-6; IL-13: interleukin-13.
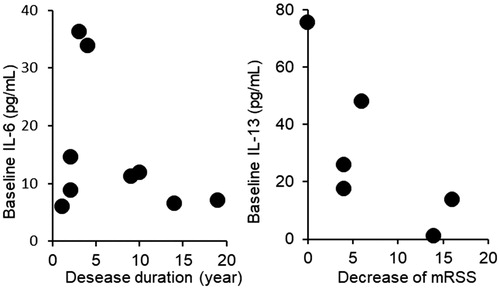
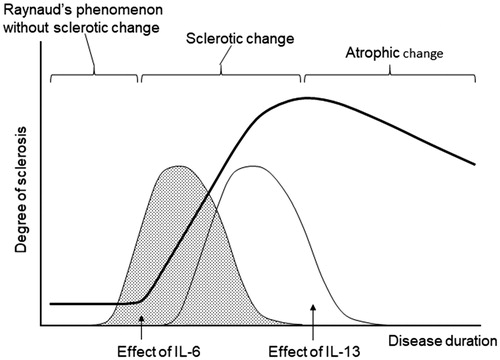
Figure 5. Schematic drawing of the correlation between sclerosis and the effect of IL-6. IL-6 plays a pathological role throughout the disease course in RA. However, pathological factors are substituted during the disease course of SSc.