
Figures & data
Figure 1. Trend in DAS28 at each observation point. Mean DAS28 values at each observation point and at 52 weeks with missing data supplemented are shown for Responders and Non-responders. The solid line is Responders, and the broken line is Non-responders. The EULAR response criteria effective rate at each observation point is shown at the bottom. LOCF, last observation carried forward.
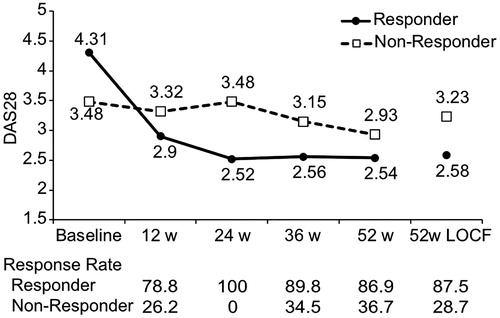
Figure 2. Treatment effect predictors. A logistic regression analysis was performed to analyze treatment effect factors. Odds ratios for the explanatory variables ultimately selected are shown. Explanatory variables were selected with a stepwise method and consideration of clinical significance. MTX, methotrexate; NSAID, non-steroidal anti-inflammatory drug.
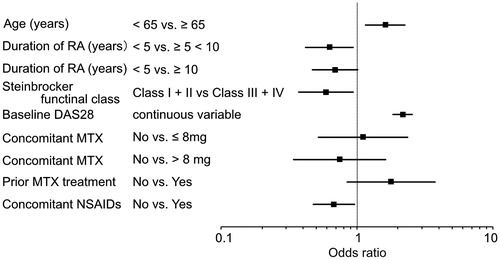
Figure 3. Adjustment of patient characteristics. Propensity score matching was done to adjust for bias in patient characteristics. The distributions before adjustment of DAS28 and age at the start of administration are shown. The black circles are Responders, and the white squares are Non-responders.
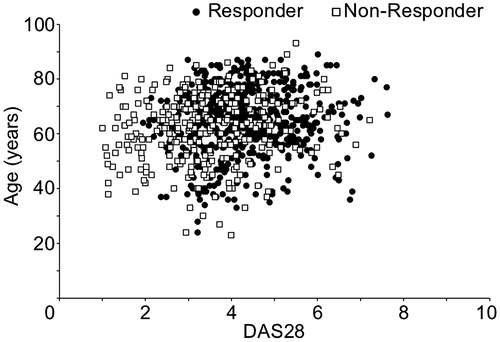
Figure 4. Trends in DAS28 after adjustment. The mean DAS28 of Responders and Non-responders after propensity score matching is shown. The solid line is Responders and the broken line is Non-responders. LOCF, last observation carried forward.
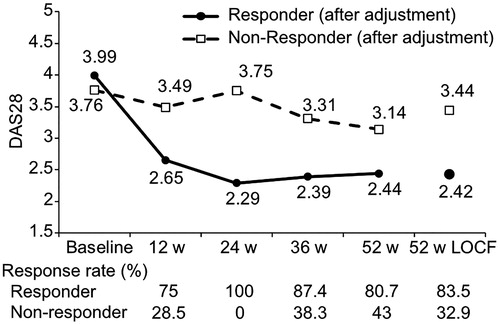
Table 1. Patient characteristics after adjustment.