
Figures & data
Table 1. Patient characteristics at the time of surgery.
Figure 1. (a) Time trends in numbers of total joint replacements and (b) time from rheumatoid arthritis onset to total joint replacement. *The Jonkheere–Terpstra trend test.
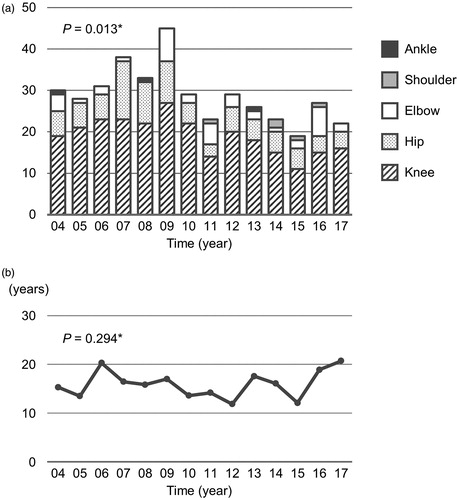
Figure 2. Time trends in (a) age, (b) proportion of patients with elderly-onset rheumatoid arthritis (EORA), (c) serum C-reactive protein (CRP) levels, (d) proportion of patients with CRP ≤0.3 mg/dl, (e) methotrexate use, (f) biologic use, (g) glucocorticoid use, and (h) osteophytes on radiograph. Data are presented as mean values or percentage. *The Jonkheere–Terpstra trend test; †The Cochran–Armitage trend test.
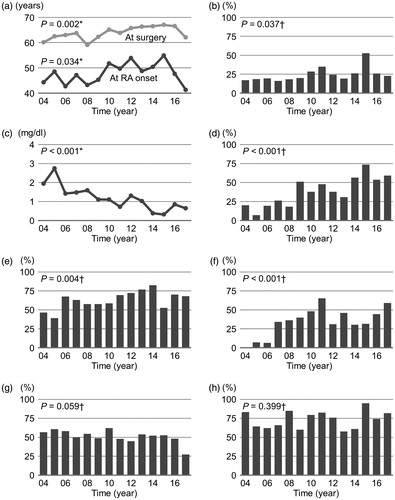
Table 2. Patient characteristics stratified by serum C-reactive protein (CRP) levels.
Figure 3. Time from rheumatoid arthritis (RA) onset to total joint replacement (TJR) stratified by (a) serum C-reactive protein (CRP) levels, (b) osteophytes on radiograph, (c) age at RA onset, and (d) surgery site. The box plot shows the median value (central line) and 25th and 75th percentiles (horizontal lines); whiskers indicate minimum and maximum values; and circles represent outliers. Statistical comparison was performed using the Mann–Whitney U test. EORA: elderly-onset RA; YORA: younger-onset RA.
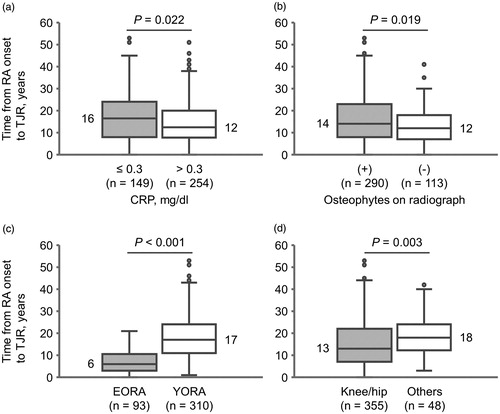
Table 3. Factors associated with time from rheumatoid arthritis (RA) onset to total joint replacement.