Figures & data
Figure 1. Reference networks (Yeo et al., Citation2011) are well matched to resting-state networks used in the current study. The reference network is plotted on the left in red, while individual ICs (significantly overlapping with that reference network) are plotted in contrasting colours within a single image on the right. All overlays are thresholded at 3 < z < 6.
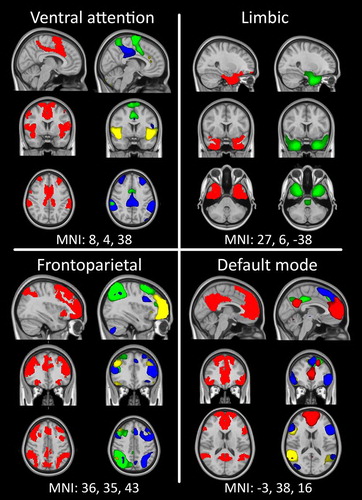
Figure 2. Basal ganglia network. This network was manually selected based on previous literature. Thresholded at 3 < z < 6.
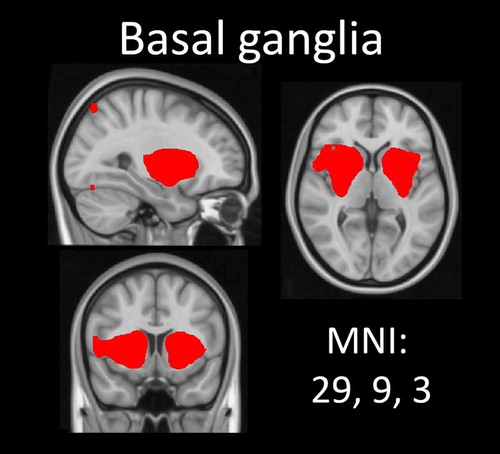
Table 1. Demographics.
Figure 3. Increased functional connectivity in gambling disordered patients compared to healthy controls within the ventral attention network. The independent component representing part of the ventral attention network, which was used as input for dual regression, is plotted in gradient from red to yellow (3 < z < 6). Comparison of this spatial map between the two groups revealed increased connectivity strength in the right insula in gambling disordered patients. For visualization purposes, these results are shown in blue, thresholded at p < 0.05 (uncorrected). Results are superimposed on a MNI152 standard space template image; orthogonal slices through the peak voxel are shown in radiological convention (right = left).
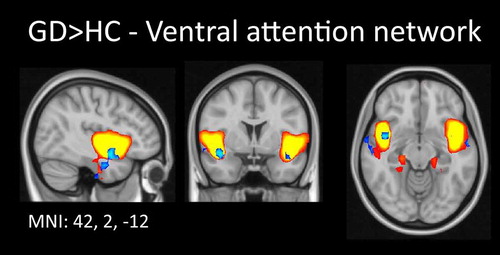
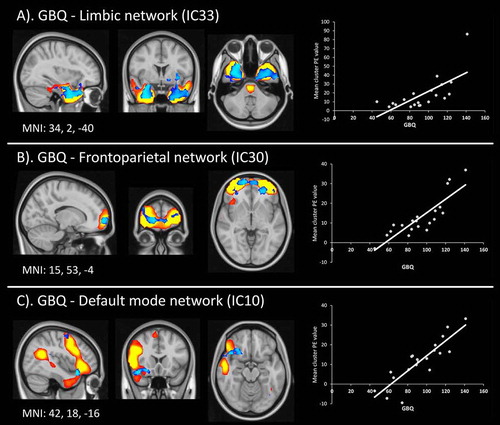
Figure 4. Number of gambling distortions covaries with resting-state networks. Spatial maps of the significant dual regression results are plotted over corresponding ICAs (see Figure for details). Results in blue show regions that covary with individual GBQ scores. For visualization purposes, these results are shown in blue, thresholded at p < 0.05 (uncorrected). Next to these results, scatter plots showing the mean functional connectivity value (PE = parameter estimate) extracted from the significant clusters (y-axis) are plotted against the GBQ scores for each individual gambling disordered patient.