
Figures & data
Table 1. Selection of studies that use interference-based methods
Table 2. Demographics and gambling preferences
Figure 1. Experimental design for both experiments. DASS-21 = Depression, Anxiety and Stress Scales; g-CEQ-S = gambling Craving Experience Questionnaire – Strength form, at baseline (Base), pre-intervention (Pre), and post-intervention (Post). Pictograms are license-free or Noun Project creations (Joseph Elsbernd, Nikita Kozin, corpus delicti, and Magicon)
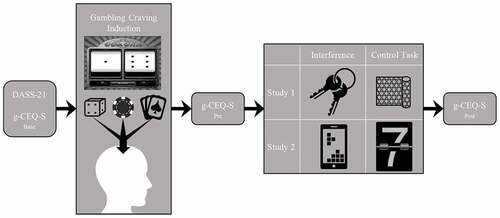
Table 3. Characteristics and reliability of scales used
Table 4. Paired samples t-tests between g-CEQ-S subscales at T1 (baseline) and at T2 (post-induction) and between g-CEQ-S subscales at T2 and at T3 (post-intervention)
Figure 2. Mean ratings of each g-CEQ-S subscale at T2 (post-induction) and T3 (post-intervention) for Experiment 1 and Experiment 2. Error bars represent standard error of the mean. g-CEQ-S = gambling Craving Experience Questionnaire – Strength form. Error bars represent standard error of the mean. g-CEQ-S = gambling Craving Experience Questionnaire – Strength form
Table A1. Independent samples t-tests between experimental and control conditions
Figure B1. Mean ratings of the intensity subscale of the g-CEQ-S at T2 (pre-intervention) and T3 (post-intervention) for Experiment 2 across three categories of gambling severity. Error bars represent standard error of the mean. The sample was divided into three categories according to the Problem Gambling Severity Index scores: low severity (0–2; n = 12), medium severity (3–7; n = 13) and high severity (8–21; n = 13). g-CEQ-S = gambling Craving Experience Questionnaire – Strength form
Data availability statement
The data described in this article are openly available in the Open Science Framework at http://doi.org/10.17605/OSF.IO/CMZGR.