
Figures & data
Figure 1. The ‘Cleo’s Gold’ slot machine simulation task. Top: a screen capture from the game’s main graphical display that depicts one segment of a multiline win animation involving the ‘wild’ pyramid symbol. The artwork was from a commercial graphics set (Envato Pty Ltd., Melbourne, VIC), used under license. Touch input was disabled on the display. Bottom: an illustration of the button panel configuration with which participants gambled. Participants configured the number of lines (top button row) and/or the bet amount per line (bottom button row), or used the repeat bet button, for each spin.
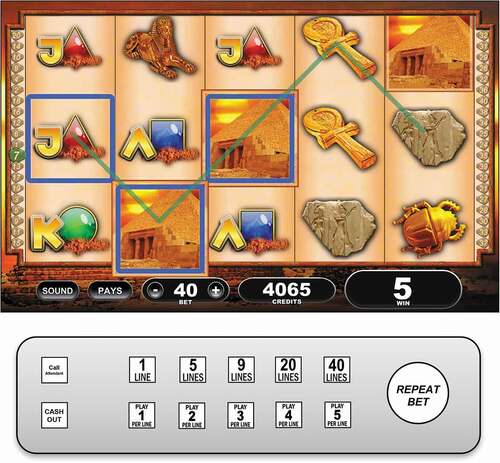
Table 1. Descriptive statistics of gambling sessions.
Figure 2. Plots depicting predicted probabilities for models integrating winning and losing trials. Models for log transformed Spin Initiation Latency (ms) and Bet Switching log odds are depicted in the top and bottom rows, respectively. Predicted probabilities for both outcome variables are plotted as a function of Trial Type (Losses, Losses Disguised as Wins, and Wins; displayed across the horizontal facets), Trial Number, and Session. The models controlled for Credit Balance (centered at the grand mean) and Sequence version (averaging across Sequences A to C). Probabilities for Spin Initiation Latency additionally controlled for Bet Switching (centered on trials that were repeat bets).
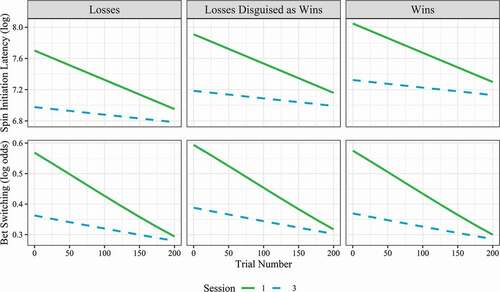
Table 2. Regression results for models separating wins and losses.
Table 3. Slope estimates for trial number for gambling sessions 1 and 3.
Supplemental Material
Download MS Word (135.8 KB)Data availability statement
The data and analysis scripts that support the findings of this study are openly available in the UBC Dataverse Collection at https://doi.org/10.5683/SP3/KWJTFU.