
Figures & data
Table 1. Descriptive statistics of the study variables.
Table 2. Inter-item correlations.
Table 3. Robust regression models estimating gaming problems, N = 1530.
Table 4. Robust regression models estimating gambling problems (PGSI), N = 1530.
Figure 1. Adjusted predictions depicting the interaction between perceived stress and in-game buying behavior).
Note. IGDT = Internet Gaming Disorder Test.
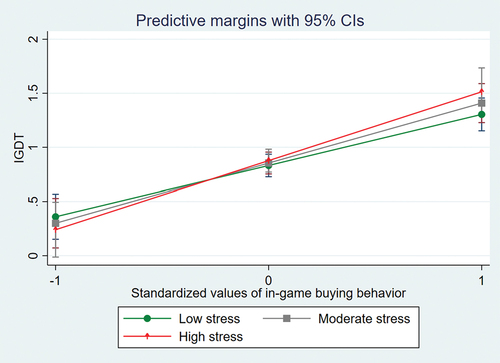
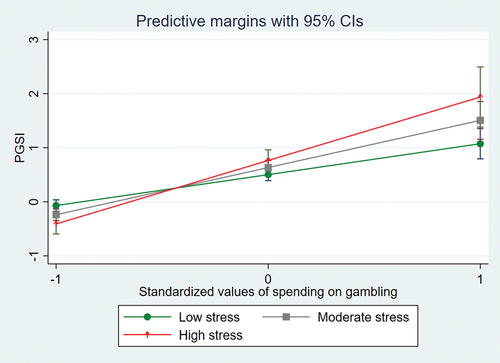
Figure 2. Adjusted predictions depicting the interaction between perceived stress and spending money on gambling.
Note. PGSI = Problem Gambling Severity Index.
Data availability statement
The data generated and analyzed in the current study are not publicly available due to the fact that they are part of research in progress but are available from author A.O. on reasonable request.