Figures & data
Figure 1. Daily stress. Upper: Average stress values for all the test subjects in 15-minute intervals (measured for each as the share of seconds that exceed the average in each 15-minute interval). Lower: percentage of seconds of stress more than twice as high as the average in 15-minute periods. The 15-minute interval of each test subject is compared to their personal average over approximately 10-day periods.
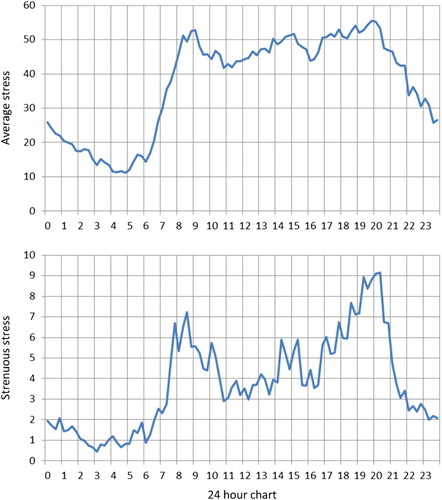
Figure 2. Stress during weekends vs. weekdays (share of seconds exceeding the stress average in 15-minute intervals.
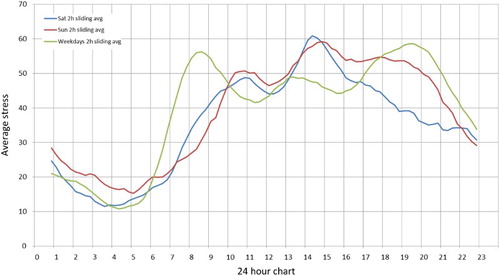
Figure 3. Stress on weekends vs. weekdays among male subjects (share of seconds exceeding the personal stress average in 15-minute intervals).
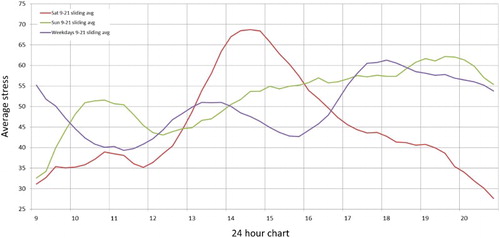
Figure 4. Stress on weekends vs. weekdays among female subjects (share of seconds exceeding the personal stress average in 15-minute intervals).
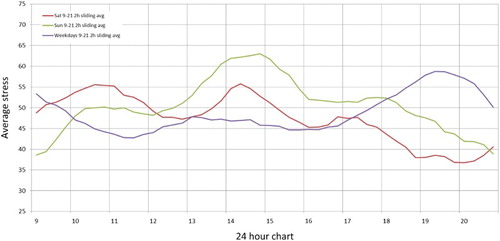
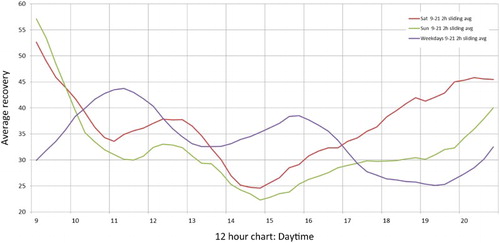
Figure 5. Recovery during the daytime (share of seconds exceeding the personal recovery average in 15-minute intervals).