Figures & data
Table 1. Total and annual investment and annual change in investment (+/-) in Indigenous land and sea management in Australia 2002–12, by investor, showing two distinct time periods i) pre 2007–08 and ii) 2007–08 onwards.
Figure 1. Location of summed ILSM projects funded over ABS Index of Relative Socio-economic Advantage and Disadvantage (IRSAD).
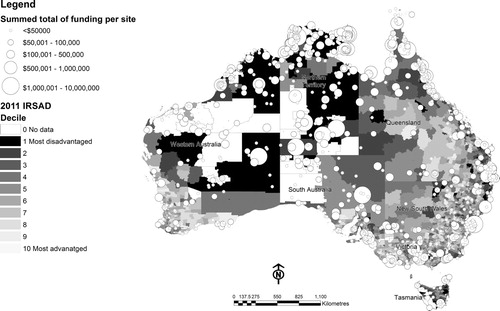
Figure 2. Location of summed ILSM projects funded over ABS Index of Economic Resources (IER).
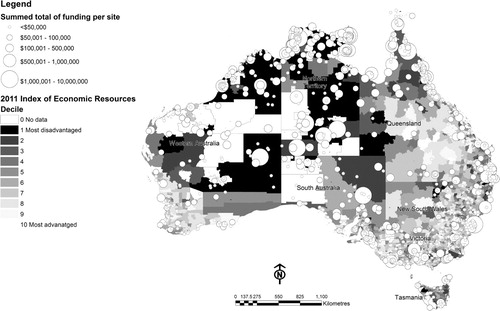
Figure 3. Location of summed ILSM projects funded over Australia’s 15 national biodiversity hotspots.
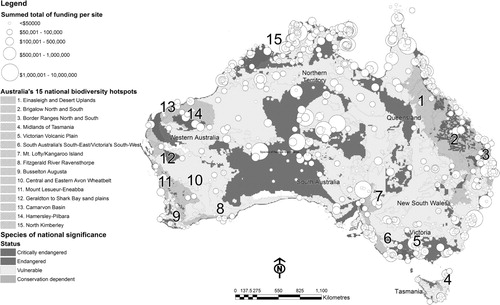
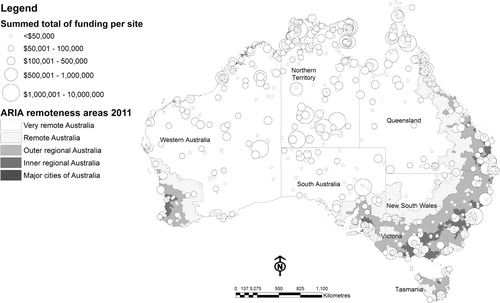
Figure 4. Map showing the location of summed ILSM projects funded over ABS Accessibility/Remoteness Index of Australia (ARIA).