Figures & data
Figure 1. Particle size distribution soil of the soil.
Table 1. Typical characteristics of the selected soil.
Table 2. Physical and chemical characteristics of the enzyme.
Figure 2. Testing for different soil mixtures. (a) UCS testing and (b) microstructural testing through the X-ray micro-tomography.
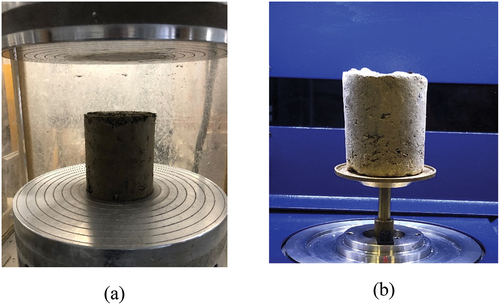
Figure 3. Optimum moisture content for the soil with and without the enzyme product.
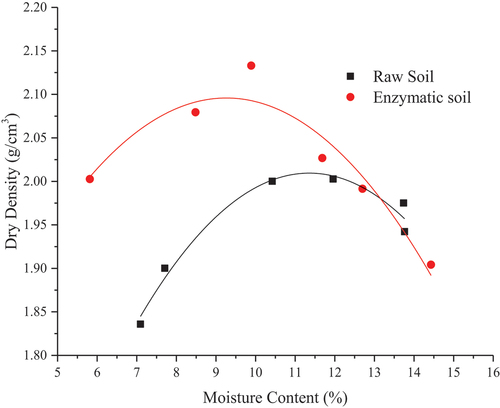
Figure 4. Bulk/Dry weight ratio for the soil mixtures with and without the enzyme product at elevated temperatures.
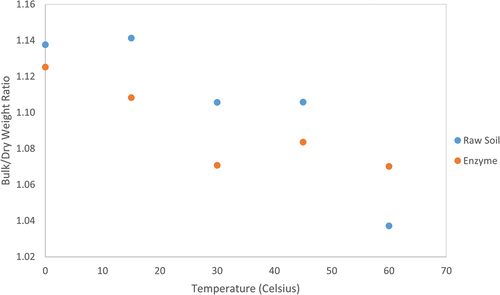
Figure 5. Unconfined compression strength for the soil mixtures with and without the enzyme product at elevated temperatures.
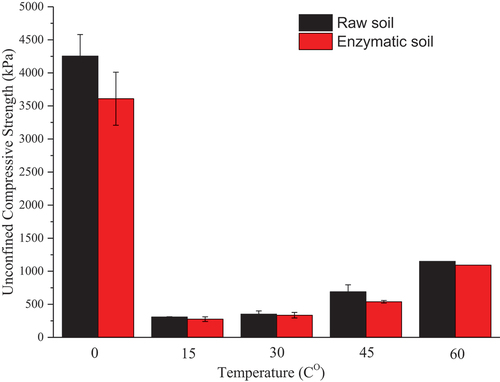
Figure 6. Three-dimensional images for raw and enzymatic soil mixtures at different elevated temperatures.
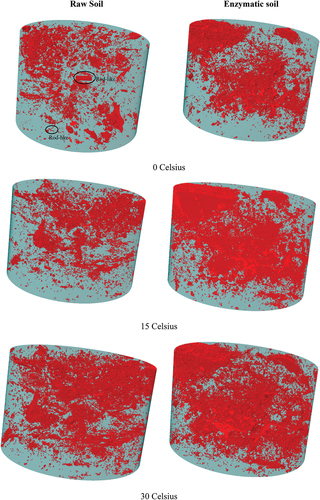
Figure 6. (Continued).
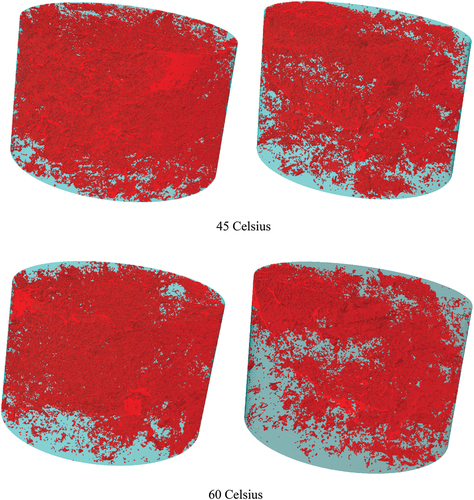
Figure 7. Porosity for raw and enzymatic soil mixtures at different elevated temperatures.
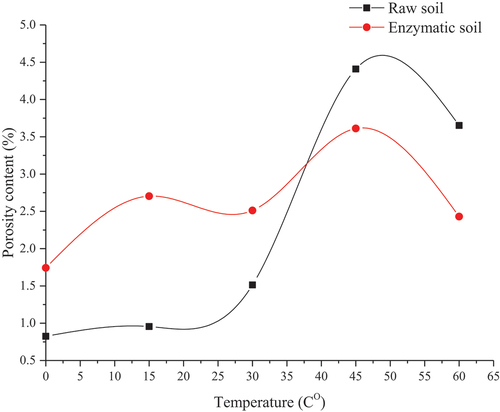
Figure 8. Pore’s volume variation for different soil mixtures at different elevated temperatures (a) raw soil and (b) enzymatic soil.
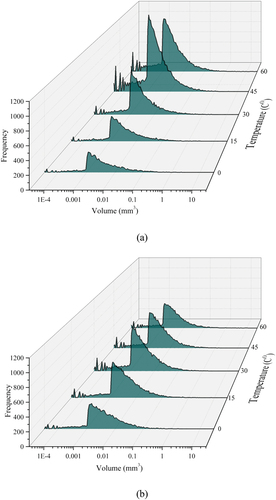
Figure 9. Sphericity variation for different soil mixtures at different zero Celsius (a) raw soil and (b) enzymatic soil.
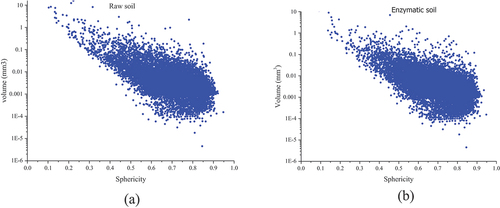
Figure 10. Probability density function curves for different soil mixtures at elevated temperatures (a) raw soil and (b) enzymatic soil.
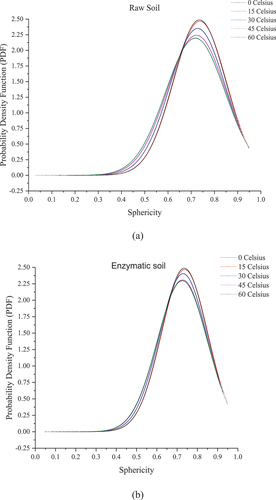
Figure 11. Structure model index for different soil mixtures at elevated temperatures (a) raw soil and (b) enzymatic soil.
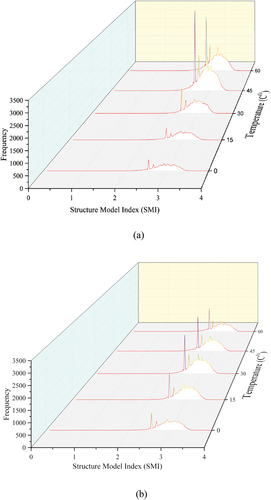
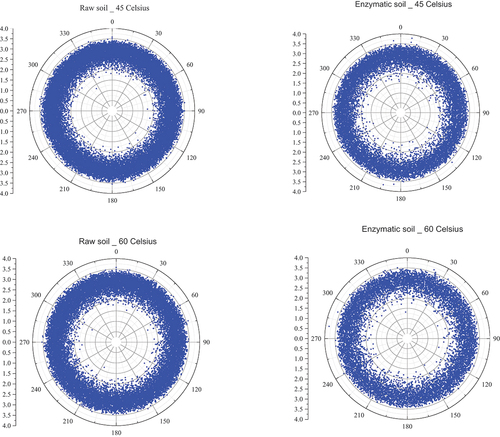
Figure 12. Void orientation for the two different soil mixtures at elevated temperatures.
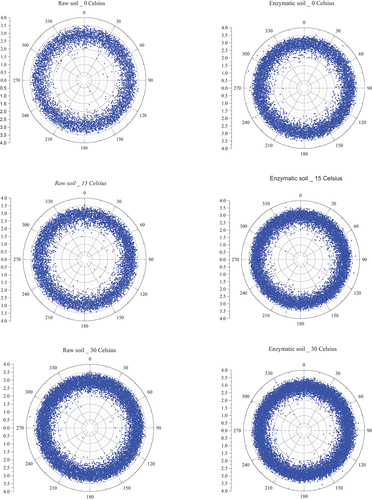
Figure 12. (Continued).