Figures & data
Figure 1. Examples of training System’s responses to perturbations.
Table 1. Examples of resilience definition increments.
Figure 2. Capability systems’ resilience framework (Jnitova et al. Citation2022).
Figure 3. Integrative resilience framework by Kantur and İşeri-Say (Citation2012, 765).
Table 2. Survey target populations.
Table 3. Summary of TORS responses.
Table 4. Issues identified in the ‘Pilot’ TORS design.
Figure 4. Alpha reliability test for the ‘Pilot’ adaptive capacity set.
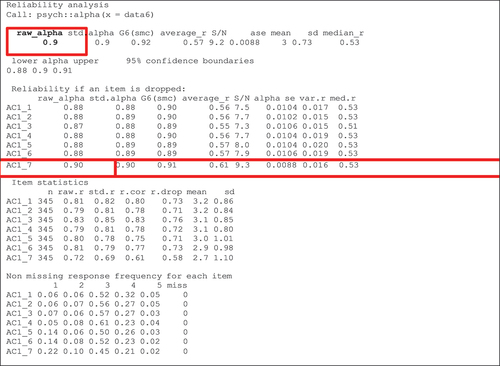
Table 5. Example of homogeneity analysis for the ‘Pilot’ application.
Figure 5. Example of ‘Pilot’ responses to a resilience question.
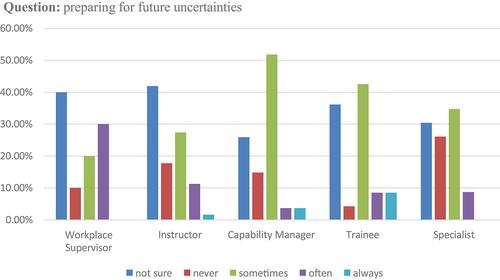
Figure 6. Two popular resilience attribute performance views from three applications.1
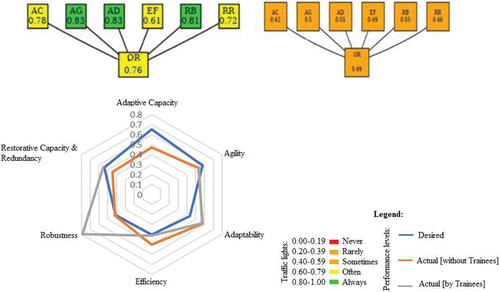
Figure 7. Examples of frequency from deductive (upper) and inductive (lower) thematic analysis of freeform responses.
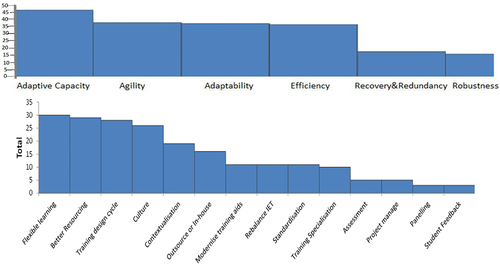
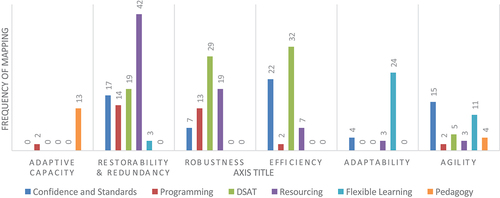
Figure 8. Example inductive code map for freeform response.
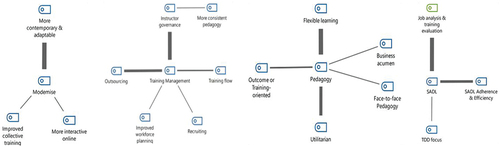
Figure 9. Example visualisations of performance ratings for extant training policy.
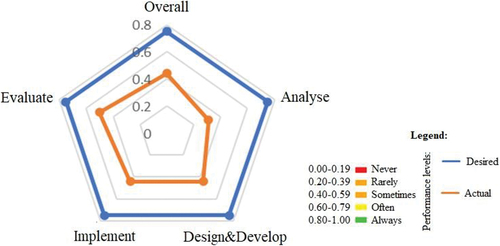
Figure 10. Example of comparative analysis of quantitative and qualitative responses.