Figures & data
Figure 1. Study area: (a) north of Iran; (b) Amol County; (c) surface deformation map.
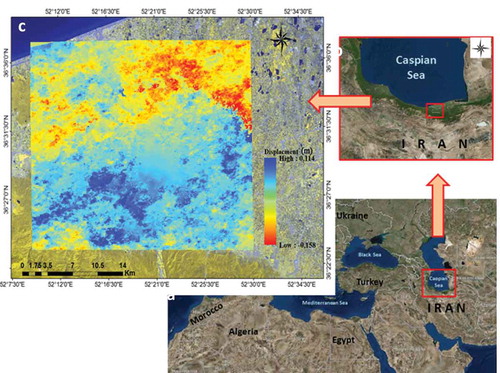
Table 1. Lithology of Amol County.
Figure 2. Nine input land subsidence factors used in the ANFIS model: (a) land use/cover; (b) ground water level; (c) aspect; (d) DEM; (e) distance to streams; (f) rainfall; (g) density of wells; (h) slope; (i) lithology.
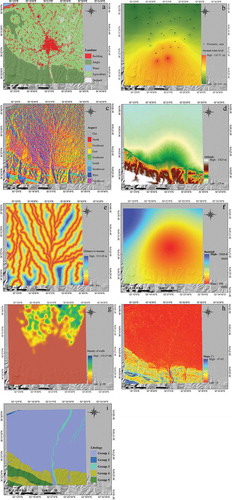
Figure 3. ANFIS architecture (Asadpour et al. Citation2013).
Figure 4. The flowchart of the integrated methodology for land subsidence susceptibility mapping and accuracy assessment.
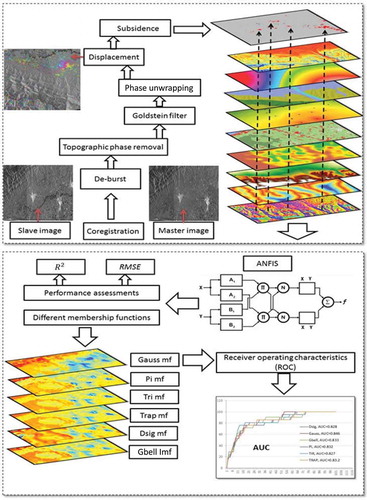
Figure 5. The extracted values of the surface deformation map to the GPS points. The first number represents the point number and the second number indicates the surface deformation map’s value at its corresponding point.
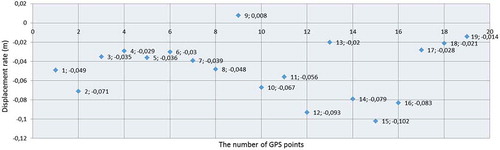
Table 2. Description of MFs and statistical criteria for RMSE, R2.
Figure 6. Training and validation data, with the location of GPS points.
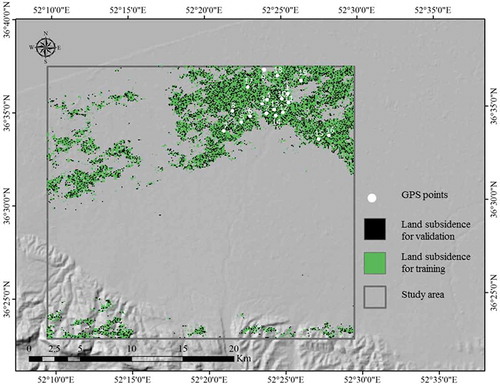
Figure 7. Land subsidence susceptibility maps using the ANFIS model with six different MFs, namely: (a) Dsig MF; (b) Gauss MF; (c) Gbell MF; (d) Pi MF; (e) Trap MF; (f) Tri MF.
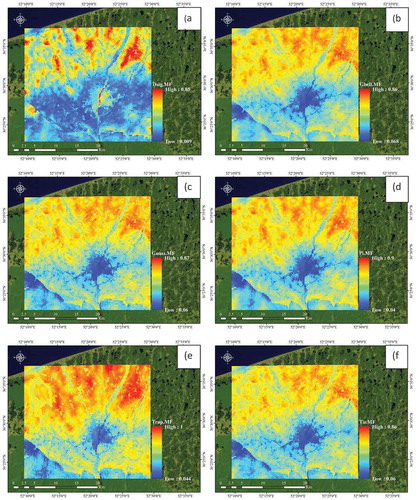
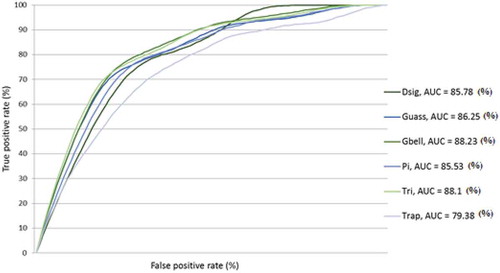
Figure 8. ROC curves for the resulting maps of the six MFs.