Figures & data
Figure 1. The geographical location of the study area.
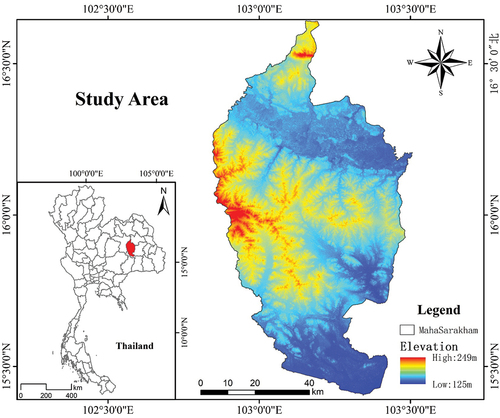
Figure 2. The research flowchart. VV and VH represented the polarisation of Sentinel-1 data. VV represented vertical transmitting and vertical receiving and VH represented vertical transmitting and horizontal receiving. The OAE is the office of agricultural economics of Thailand. MLP-BP is the multilayer perceptron BP neural network regression model.
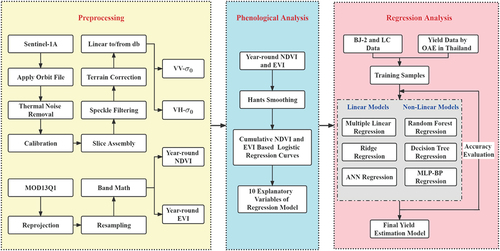
Figure 3. The phenological analysis results of main rice. (a) Result of the cumulative NDVI based logistic regression curves method; (b) Result of the cumulative EVI based logistic regression curves method.
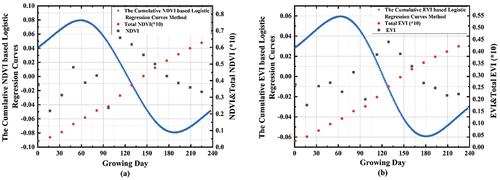
Figure 4. The phenological analysis results of second rice. (a) Result of the cumulative NDVI based logistic regression curves method; (b) Result of the cumulative EVI based logistic regression curves method.
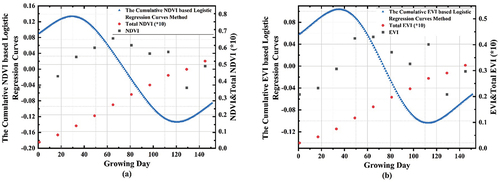
Table 1. The explanatory variables of two season-rice yield estimation regression model. The lower right number is the day of year in 2018.
Table 2. The accuracy of six linear and nonlinear regression models in the training and validation samples.
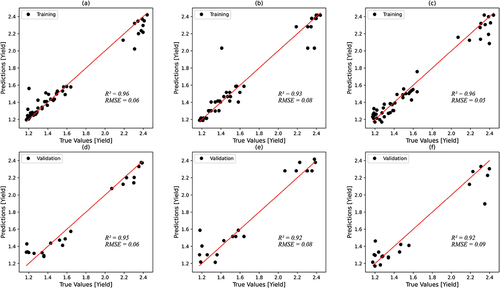
Figure 5. The accuracy evaluation results of three linear regression models. (a, d) Multiple linear regression model; (b, e) Ridge regression model; (c, f) ANN regression model. The unit of RMSE, the true and predicted yield is ton/ha.
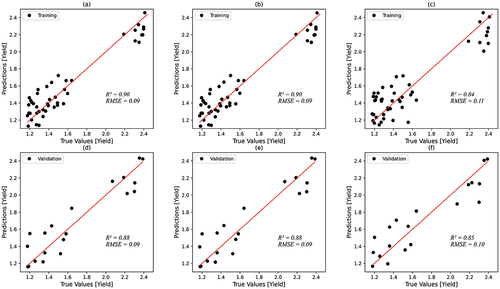
Figure 6. The accuracy of ridge regression model with different alpha parameters and the value of accuracy is the coefficient of determination, R2.
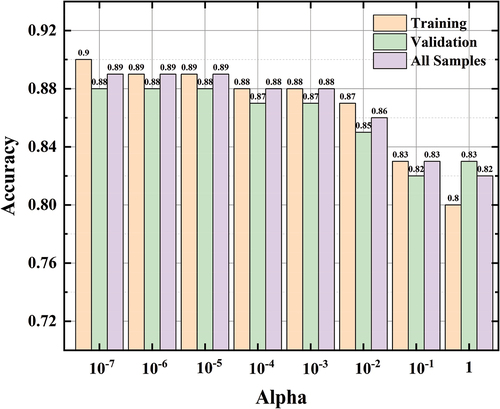
Figure 7. The accuracy evaluation results of three nonlinear regression models. (a, d) RF regression model; (b, e) DT regression model; (c, f) MLP-BP regression model. The unit of the true yield, predicted yield and RMSE is ton/ha.