
Figures & data
Figure 1 (A) The location of the Burren within Ireland. (B) Bathymetry map of Lough Inchiquin with depth contours shown in metres. (C) The distribution of archaeological sites within the study area. The catchment of Lough Inchiquin is indicated by the black outline. Archaeological sites are labelled and divided chronologically.
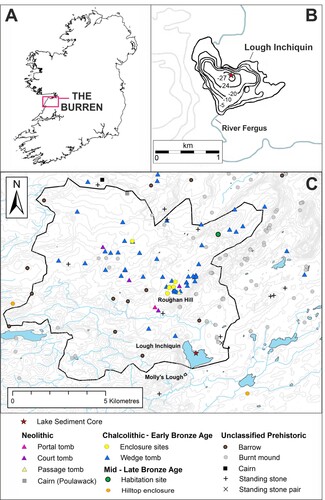
Figure 2. Relative percentage chironomid abundance plotted against sediment depth and corresponding age axis and divided into statistically significant chironomid assemblage zones (CAZ). Taxa arrangement follows RDA Axis 1 scores (lake trophic status). The Neolithic Landnam is highlighted in light blue and the period of most significant erosion is highlighted in orange.
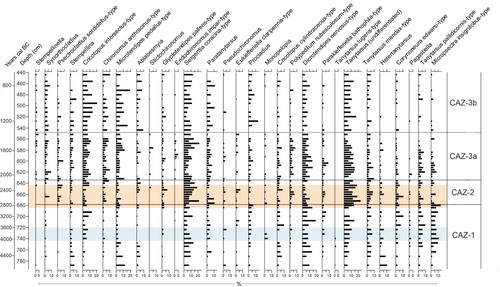
Figure 3. Organic and inorganic geochemistry results plotted by age (cal. years BC) with a corresponding depth axis. Grey lines indicate the full sampling resolution of each analysis while black lines indicate values at chironomid sampling depths. Zonation is based on chironomid assemblage zones (CAZ). Archaeological time periods are shown on the right-hand side. The Neolithic Landnam is highlighted in light blue and the period of most significant erosion is highlighted in orange.
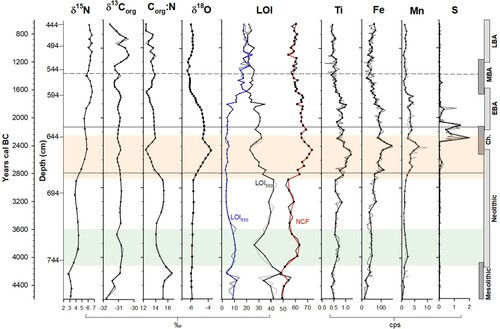
Figure 4. Composite diagram of chironomid, organic geochemistry, inorganic geochemistry and selected pollen data, plotted to a time scale of cal. years BC. Zonation is based on chironomid assemblage zones (CAZ). Archaeological time periods are shown on the right. The Neolithic Landnam is highlighted in light blue and the period of most significant erosion is highlighted in orange. Pollen curves from Spencer et al. (Citation2019).
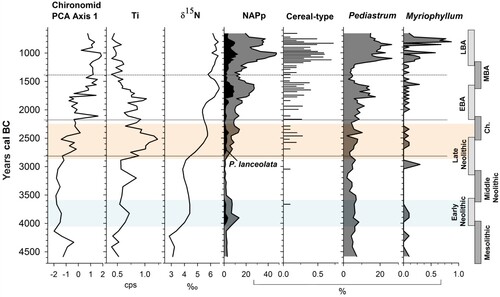
Figure 5. PCA bi-plots. (A) Chironomid samples with environmental variables. (B) Chironomid taxa with environmental variables. Chironomid taxa are abbreviated as follows ABLA = Ablabesmyia; CHIA = Chironomus anthracinus-type; CLAD = Cladopelma; CLAM = Cladotanytarsus mancus-type; COAR = Corynoneura arctica-type; COCO = Corynoneura coronata-type; COED = Corynoneura edwardsi-type; CRCY = Cricotopus cylindraceus-type; CRIN = Cricotopus intersectus-type; CRSY = Cricotopus sylvestris-type; DICR = Dicrotendipes nervosus-type; ENDA = Endochironomus albipennis-type; ENDI = Endochironomus impar-type; ENDT = Endochironomus tendens-type; EUKC = Eukieferiella claripennis-type; GLYP = Glyptotendipes pallens-type; GLYS = Glyptotendipes severini-type; GUTT = Guttipelopia; HETE = Heterotanytarsus; HETG = Heterotrissocladius grimshawi-type; LAUT = Lauterborniella; LIMN = Limnophyes; MAI = Micropsectra insignilobus-type; MICP = Microtendipes pedellus-type; MONO = Monopelopia; PAGA = Pagastiella; PVAR = Parachironomus varus-type; PARM = Paramerina; PARA = Paratanytarsus; PTNU = Paratendipes nudisquama-type; PABA = Parakiefferiella bathophila-type; PHFL = Phaenopsectra flavipes-type; POLN = Polypedilum nubesculosum-type; POSO = Polypedilum sordens-type; PROC = Procladius; PSEU = Pseudochironomus; SERG = Sergentia coracina-type; STEM = Stempellina; S/Z = Stempellinella; STIC = Stictochironomus; SYNO = Synorthocladius; TAN = Tanytarsus undifferentiated; TALA = Tanytarsus lacetescens-type; TALU = Tanytarsus lugens-type; TANM = Tanytarsus mendax-type; TANP = Tanytarsus pallidicornis-type; THIE = Thienemannimyia.
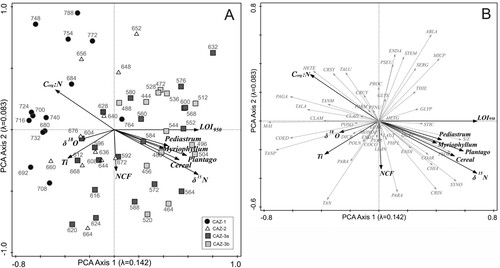
Figure 6. RDA bi-plots. (A) Chironomid species with forward-selected environmental variables (δ15N and Ti). (B) Chironomid taxa with forward-selected environmental variables. Chironomid abbreviations as in .
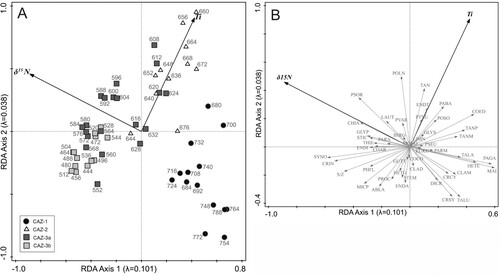
Table 1. Summary statistics for PCA and RDA (*p < 0.05).
Table 2. Partial RDAs for forward selected variables.