Figures & data
Figure 1. Study area of impact assessment. Source: Author.
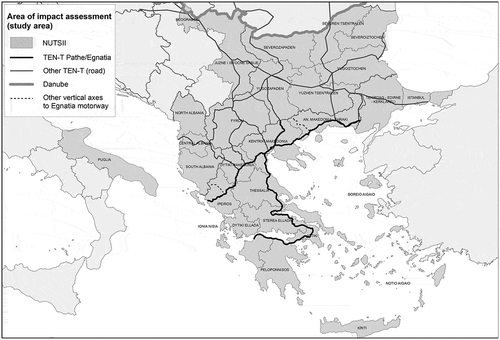
Figure 2. Methodological model flowchart.
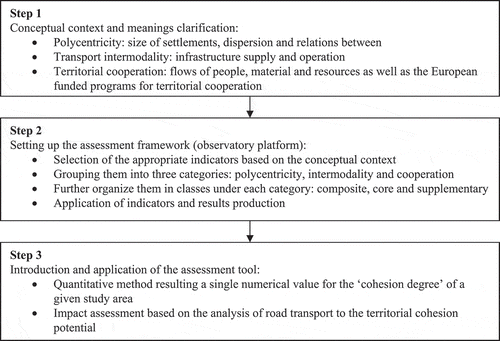
Table 1. System of indicators.
Figure 3. Distribution of settlements according to the population and GDP/capita.
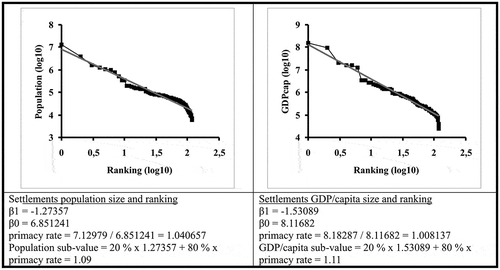
Figure 4. Lorenz curve of beneficiary population (D value).
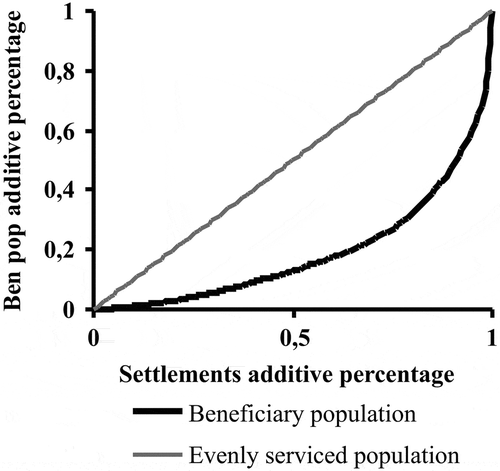
Figure 5. Lorenz curve of potential attractiveness (C value).
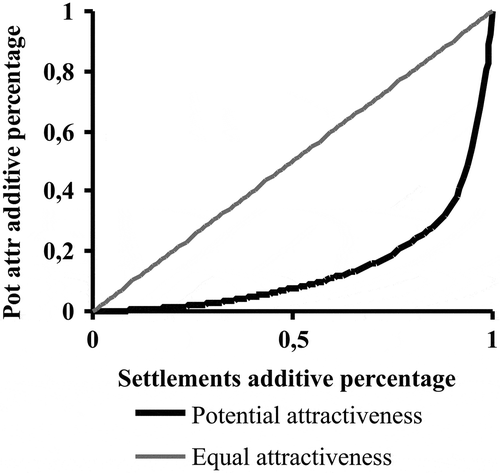
Figure 6. Triangular diagram of the cohesion degree.
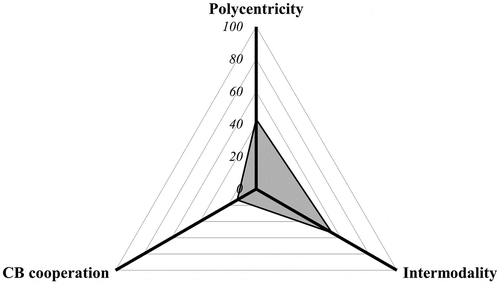
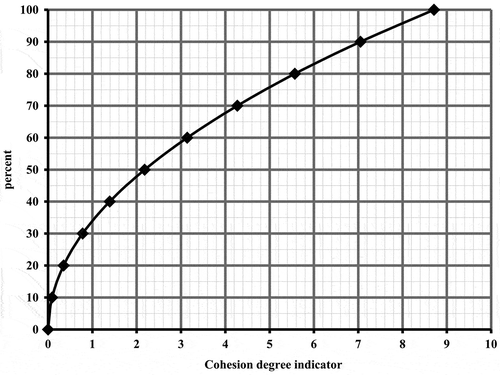
Figure 7. Nomogram for the cohesion degree interpretation.