Figures & data
Table 1. Examples of the policy recommendation made in three studies of SEA systems.
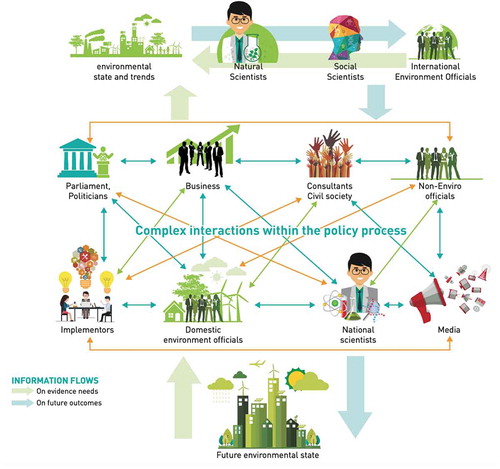
Figure 1. A representation of the science-policy interface.
Source: (UNEP Citation2017)
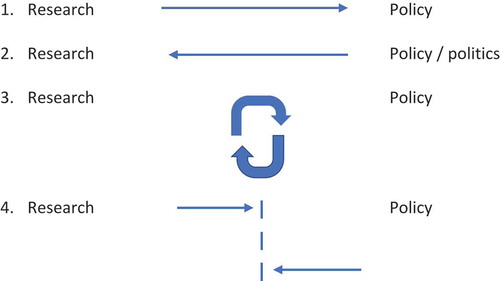
Figure 1. Science-policy relations.
Notes: The figure depicts four models of research-policy relations: 1. Research informs policy; 2. Policy and politics shape research; 3. Research and policy are coproduced; and 4. Research and policy are autonomous domains.Source: adapted from (Boswell and Smith Citation2017)