Figures & data
Table 1. Number of PP participants registered, approached and interviewed.
Figure 1. Participants holding/not holding positions in 12 ESIAs (n=85).
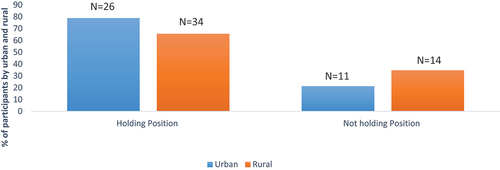
Figure 2. Type of positions held (CBO = Community Based Organisation).
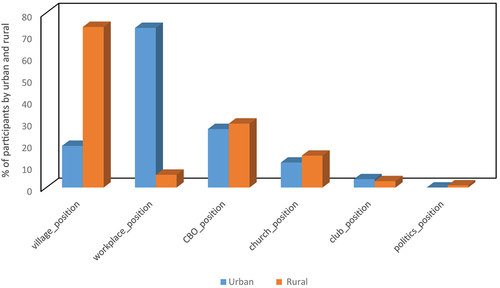
Table 2. Affected and unaffected having no position and one or more positions.
Table 3. Number of Participants holding positions.
Table 4. Types of positions held, showing both frequencies and percentages in urban and rural areas.
Table 5. People’s ability to actively contribute in PP meetings.
Table 6. People holding positions and people saying they were able to contribute.
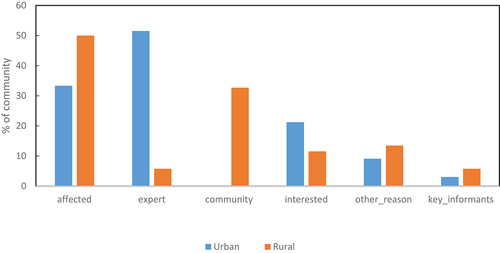
Figure 3. Reasons for why participants thought they were invited to PP meetings.