
Figures & data
Figure 1. Zambezi conservancies and tourism enterprises. Source: Authors.
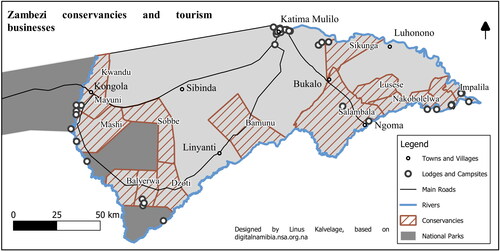
Table 1. Distribution and ownership of lodges in the Zambezi region.
Table 2. Ownership of hunting operators active in Zambezi conservancies.
Figure 2. Value capture patterns in Zambezi conservancies. Source: Authors, inspired by Naidoo et al. (Citation2016) and based on Namibian Association of CBNRM Supporting Organisations Working Groups (2017).
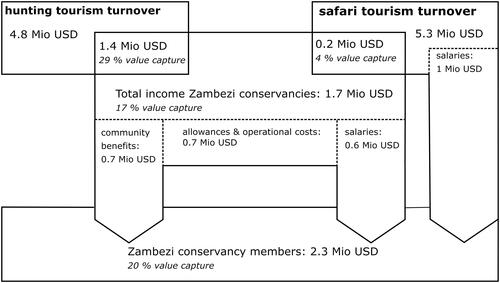
Table 3. Income and value capture of Zambezi conservancies. Source: own calculations based on NACSO data (Namibian Association of CBNRM Supporting Organisations Working Groups, 2017).